


Nolensville home sales surged as inventory tightened and mortgage rates climbed. September apparently did not get the memo that the fall real estate market was supposed to be quiet.
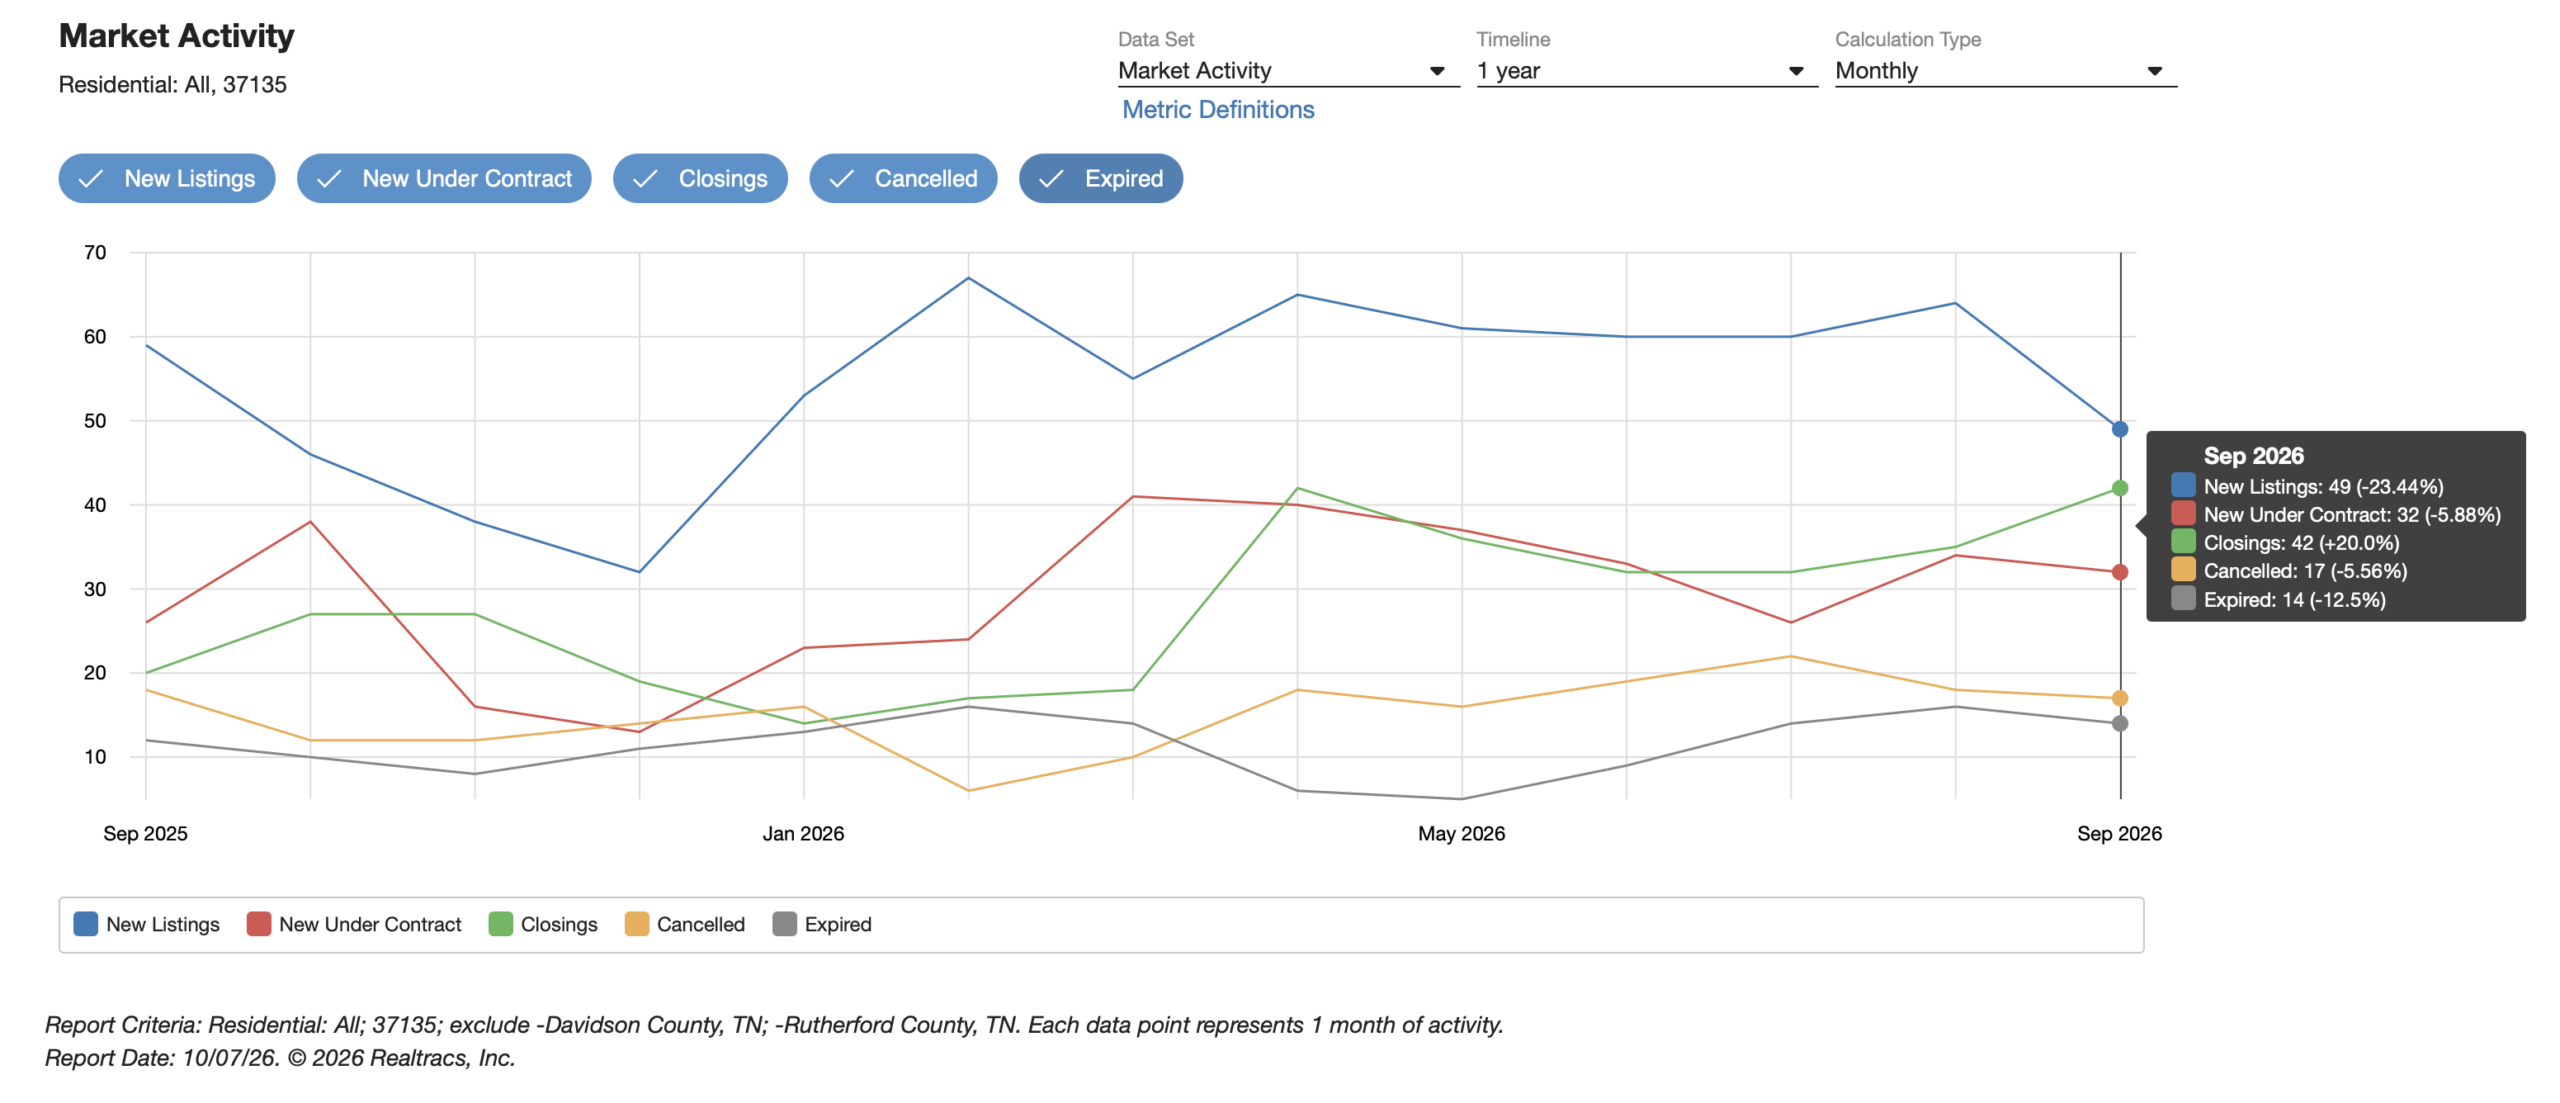
With football back, school schedules settled, and everyone trying to remember where they stored the Halloween decorations, you might have expected the Nolensville housing market to ease into a slower pace. Instead, 42 homes closed in the Williamson County portion of Nolensville during September. That was more than double the number of closings from September 2025, and tied April for the busiest closing month of 2026.
That sounds like a straightforwardly hot market… but it was not quite that simple. Mortgage rates climbed sharply during the month. New listing activity fell. Showings softened from August. Buyers were still writing contracts, but they were doing the math with a sharper pencil.
The best short description of the September 2026 Nolensville real estate market is this: more competitive than Greater Nashville as a whole, stronger than the national headlines suggest, but still very sensitive to price and monthly payment.
A quick note about the data: The statistics below cover residential sales in Nolensville while excluding the Davidson and Rutherford County portions of town. I use the Williamson County portion for continuity in my monthly reporting.
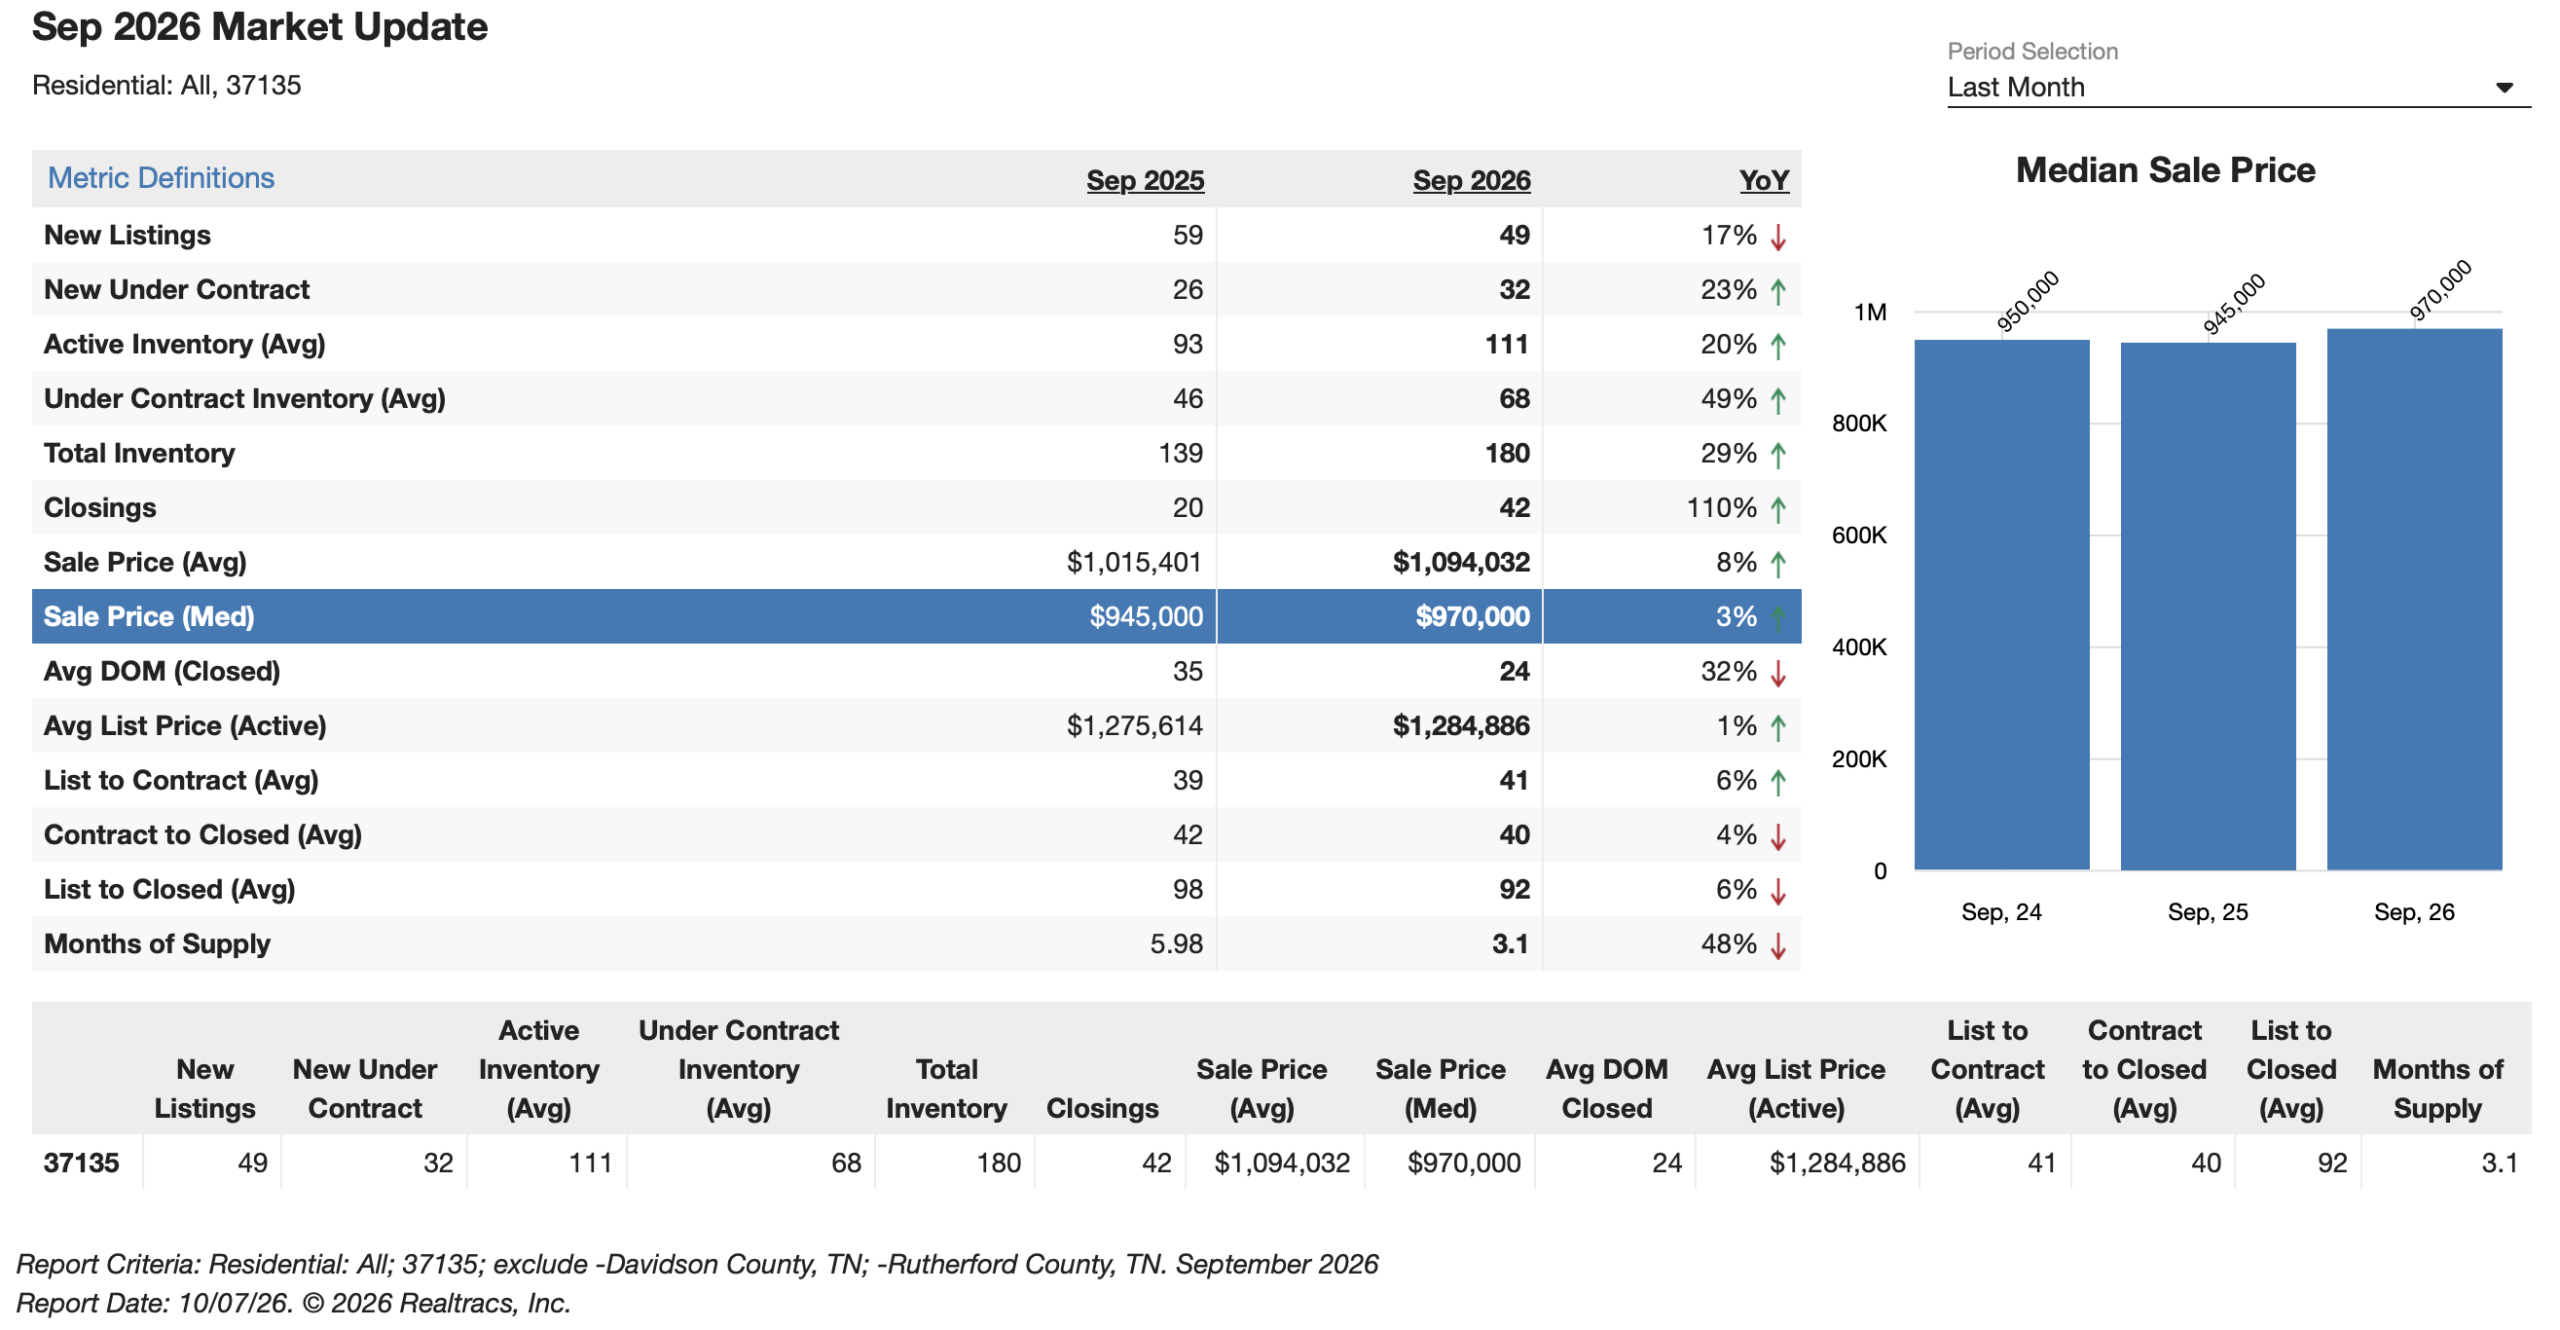
September 2026 Nolensville Real Estate Market Snapshot
September Brought A Real Closing Surge
The headline number is hard to miss: 42 closings, compared with only 20 in September 2025. That 110% year-over-year increase made September one of the strongest closing months Nolensville has posted all year.
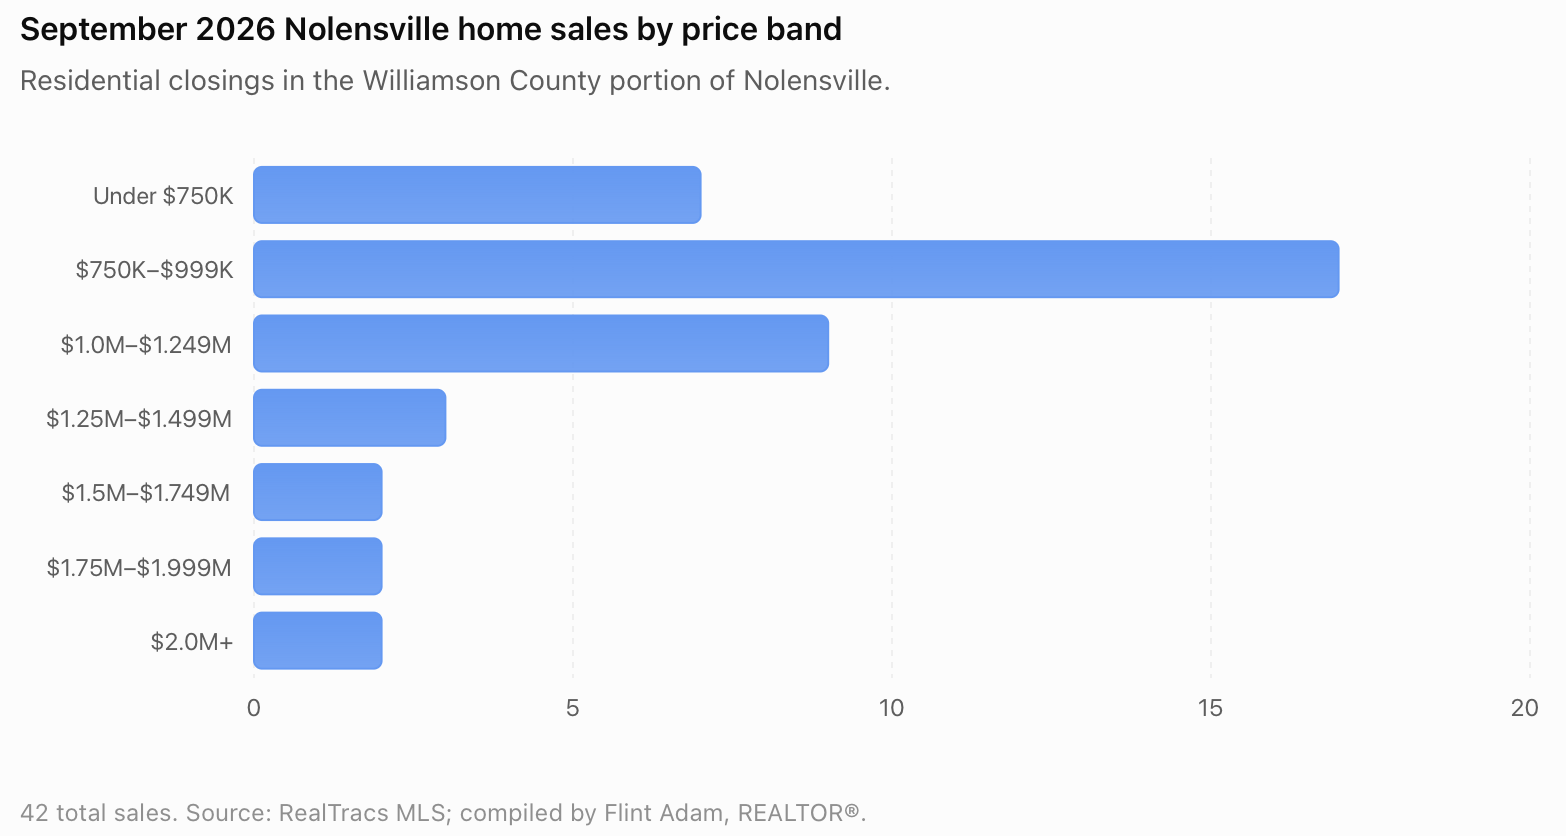
There was also real depth behind the total. The 42 sales ranged from $477,500 to just under $2.9 million. Eighteen of the closings were at $1 million or more, six reached at least $1.5 million, and eight were new or to-be-built homes. That higher-end activity helped lift the average sale price above $1.09 million.
That mix matters. When nearly 43% of a month’s closings are seven-figure sales, the average can put on a nicer jacket than the typical transaction. The median price of $970,000 gives us the more grounded middle-of-the-market number.
September’s closings also completed the story that began earlier in the summer. Closings are a lagging indicator; most of these homes went under contract weeks before the moving truck arrived. The 34 contracts written in August helped feed the 42 September closings. That is why I never judge a market by one number alone.
Buyer Demand Is Still Running Ahead Of Last Year
Through the first nine months of 2026, the Williamson County portion of Nolensville recorded 268 closings. During the same period in 2025, there were 217. That is an increase of roughly 24%.
New under-contract activity is also running ahead of last year. Nolensville recorded approximately 290 new contracts from January through September, compared with 229 during the first nine months of 2025, an increase of about 27%.
New listings increased at a much slower pace: about 534 through September 2026 versus 491 through September 2025, or roughly 9%. That relationship is important. Demand grew about three times faster than new listing activity on a percentage basis.
The current pace is not the old blink-and-the-house-is-gone market. Buyers are selective, and the wrong listing can sit quietly while a better-positioned home a few streets over attracts attention. But the year-to-date numbers make one point very clearly: buyers have continued choosing Nolensville in 2026.
Inventory Rose Year Over Year But Tightened During September
This is where the September data becomes more interesting.
Average active inventory was 111 homes, up 20% from 93 a year earlier. Total inventory, which includes active and under-contract homes, reached 180, up 29% year over year. Those numbers suggest buyers had more choices than they did last fall.
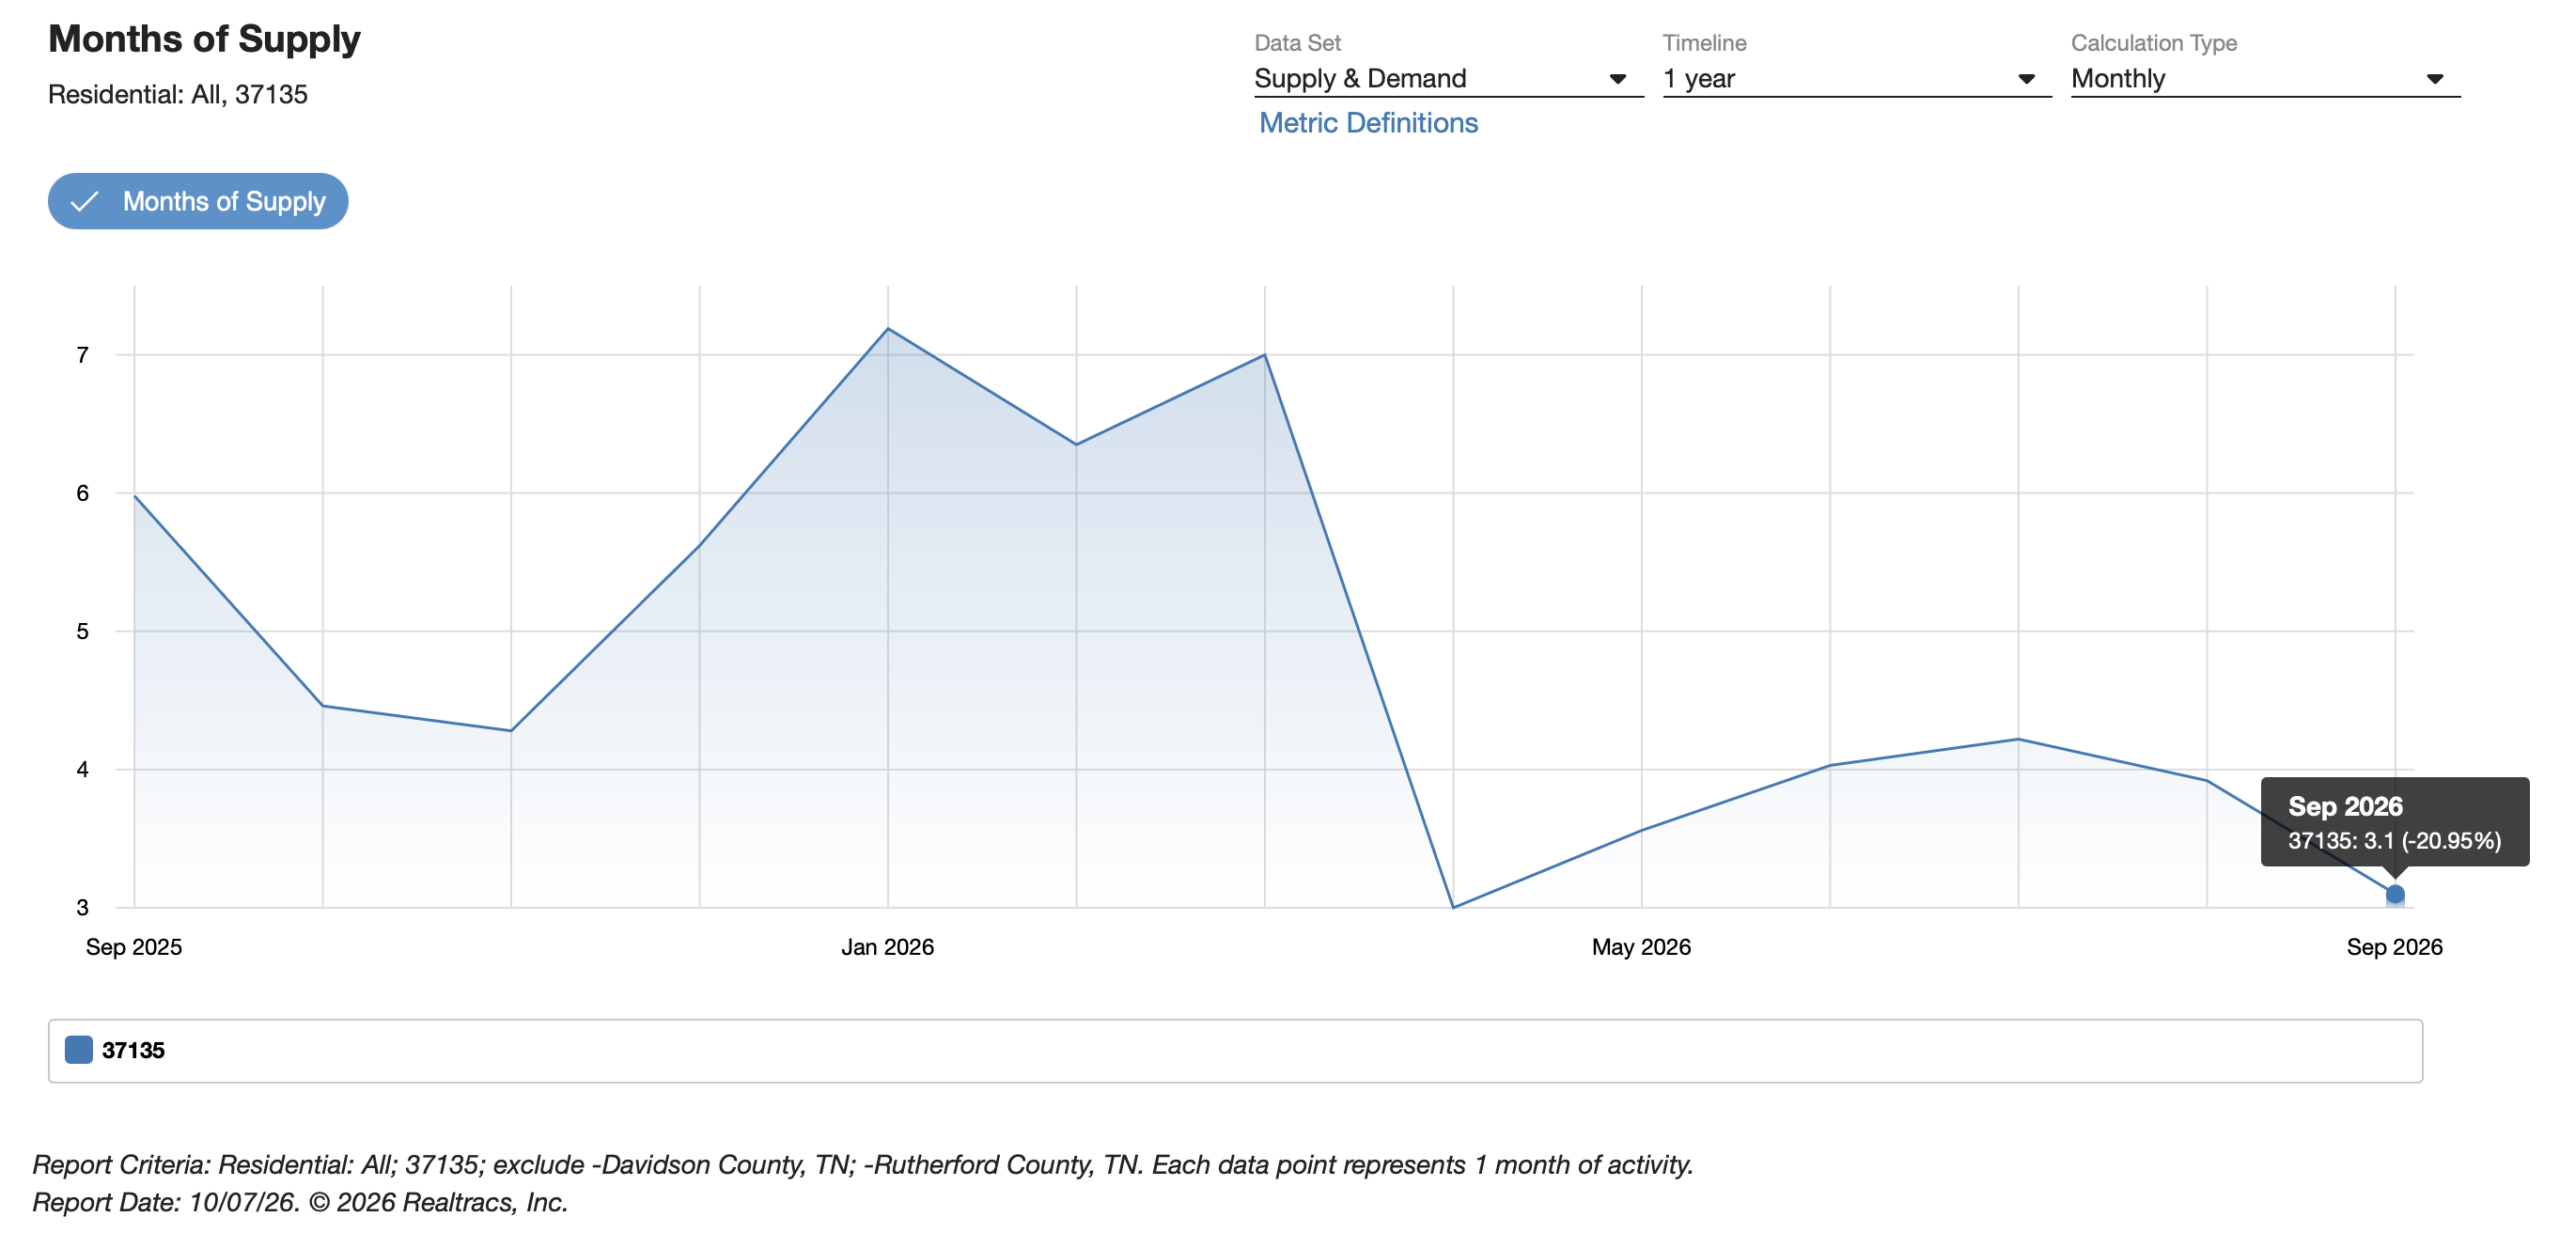
At the same time, months of supply fell to 3.1, down from 5.98 months in September 2025 and 3.92 months in August. Active inventory also slipped from 115 in August to 111 in September.
How can inventory be higher than last year while supply is much lower? Because months of supply is not just a count of homes. It compares available inventory with the current sales pace. September’s closing pace accelerated dramatically while fewer new listings came to market. The numerator grew from last year, but the denominator hit the gas.
New listings fell to 49, down 17% from last September and down from 64 in August. Meanwhile, under-contract inventory averaged 68 homes, up 49% year over year. Put it together and the Nolensville market ended September tighter than the raw inventory total might make it appear.
A 3.1-month supply is not 2021, and nobody needs to arrive at a showing carrying an offer form and a fainting couch. But it is seller-leaning territory, especially for homes that are updated, priced correctly, and located in the neighborhoods buyers are watching most closely.
Nolensville Home Prices Remained Resilient
September’s median sale price was $970,000, up 3% from $945,000 in September 2025. The average sale price rose 8% to $1,094,032, and the median selling price per square foot reached $307.
That is healthy price performance, especially against a backdrop of higher borrowing costs. It does not mean every Nolensville home appreciated by 3% or 8%. Monthly figures in a town our size are heavily influenced by what happened to close. September had 18 sales above $1 million and two above $2.5 million, so the luxury mix pulled the average higher.
The sale-to-list-price ratio offers another useful reality check. Homes that closed in September sold for an average of 98.03% of their final list price. Buyers negotiated, but the typical discount was not a wholesale surrender. The market made room for conversation, not chaos.
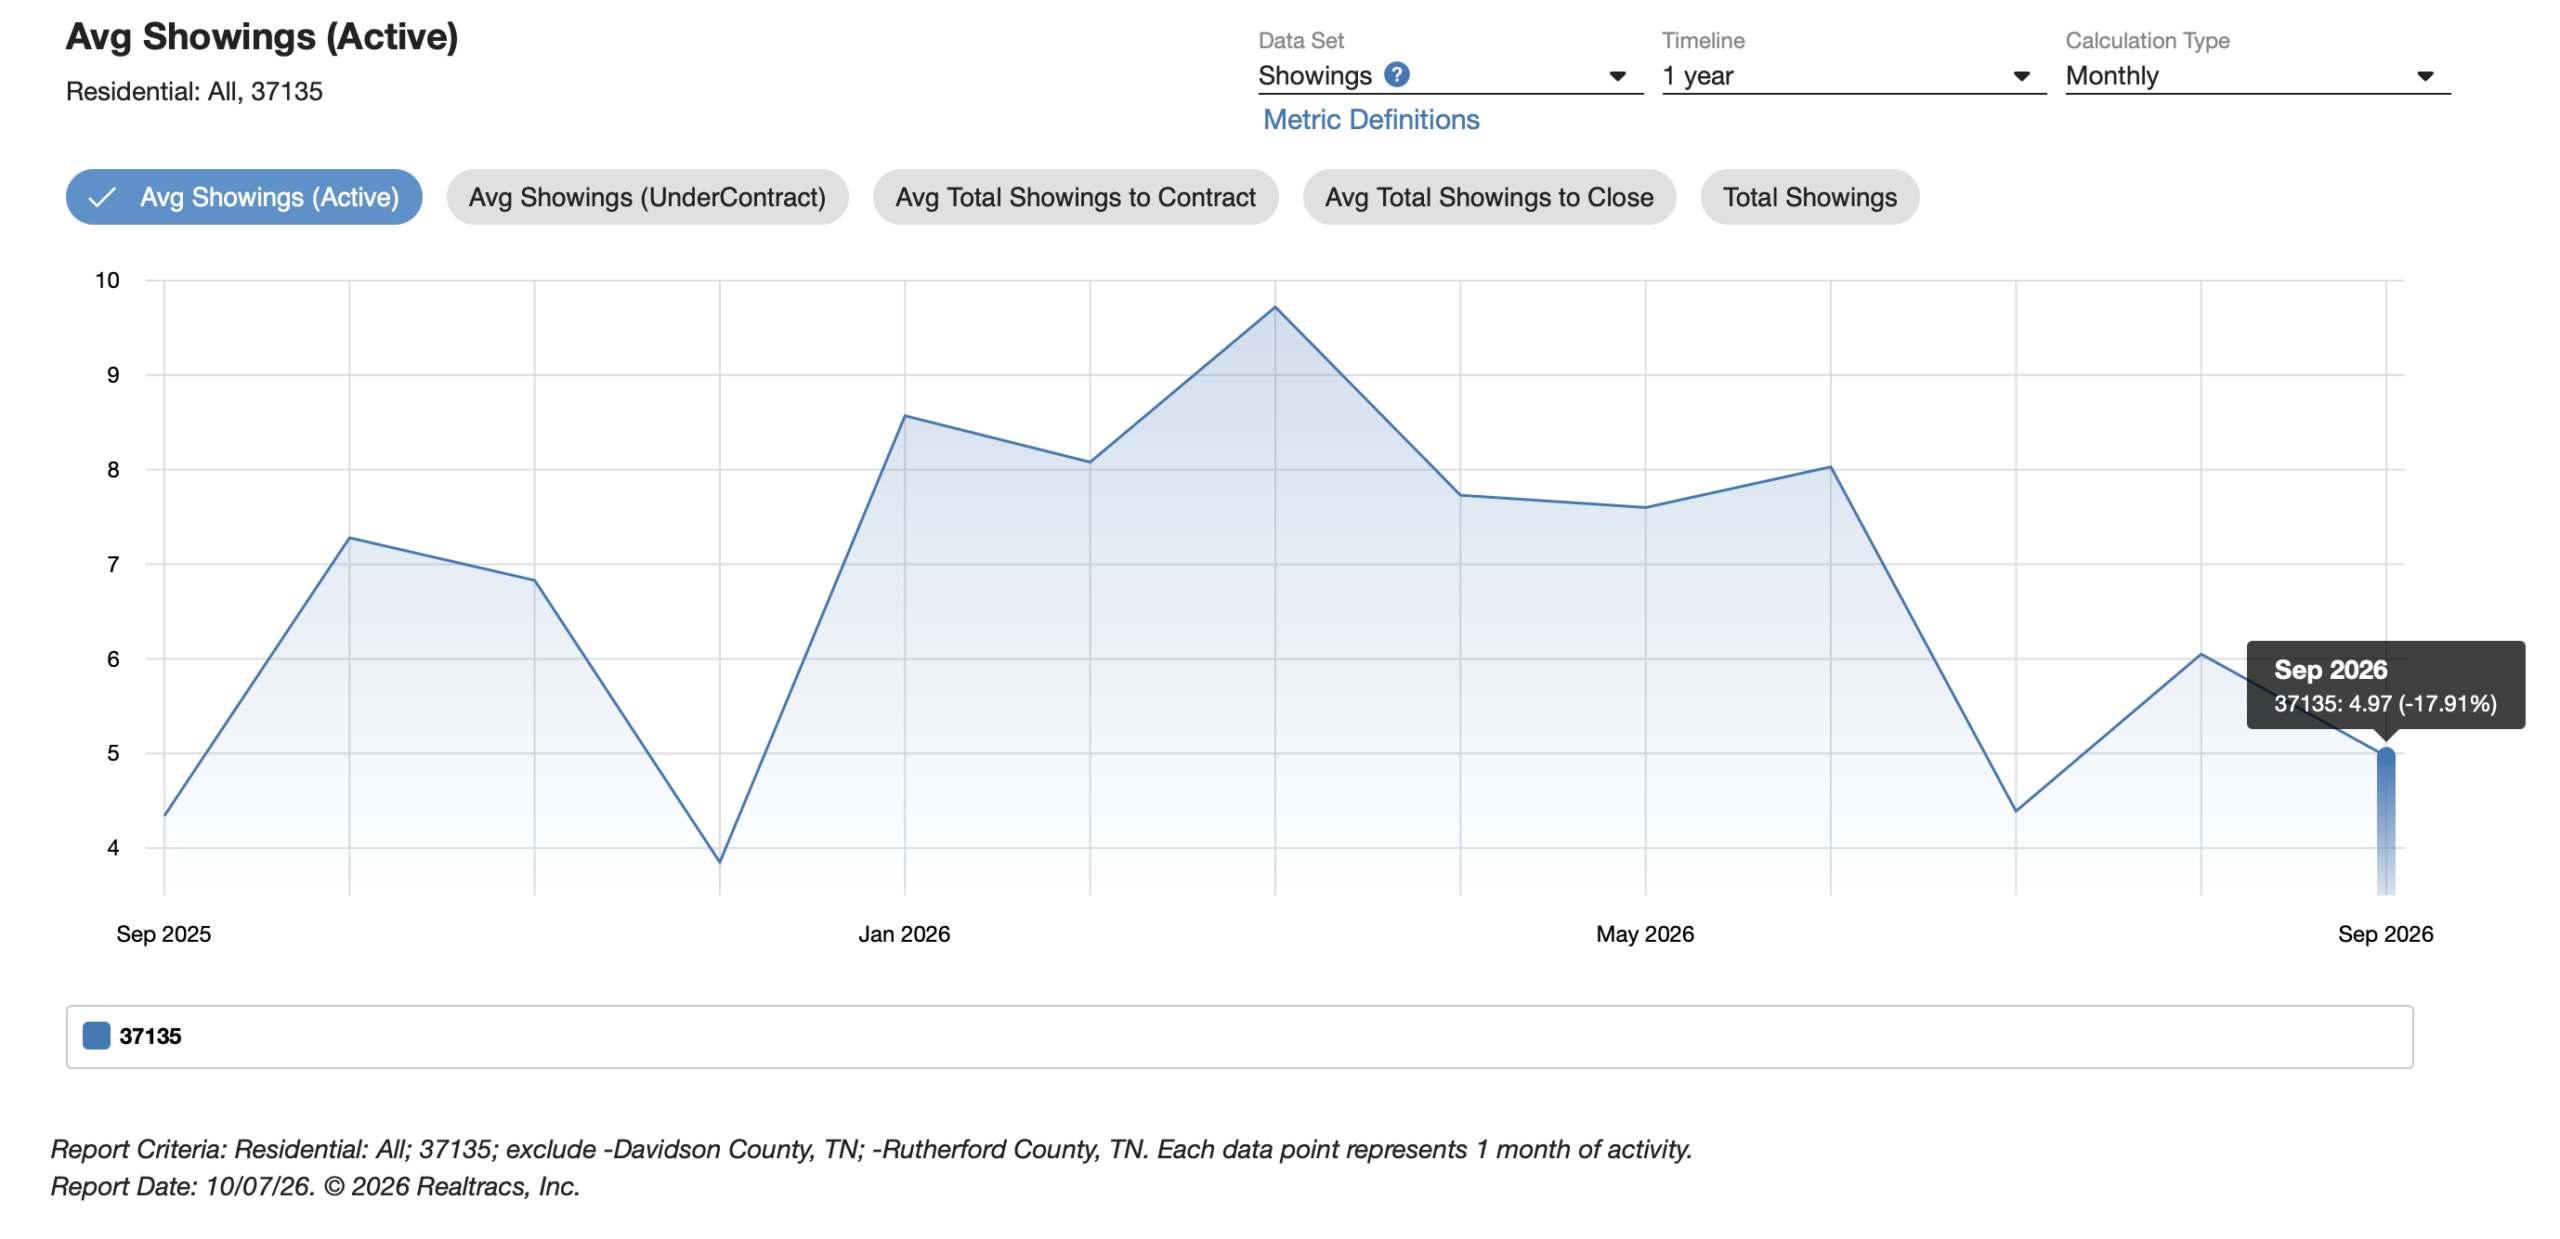
Closed homes averaged 24 days on market, down from 35 days a year ago. That was a strong result, but it deserves one caution: closed-sale statistics naturally highlight the homes that found buyers. Average showings on active listings fell to 4.97 in September, about 18% below August. The finishers crossed the line quickly, but fewer spectators were arriving at the starting gate by month-end.
Mortgage Rates Took Over The Plot Again
In my June report, I called mortgage rates the main character in the housing-market movie. By the end of September, they had stopped reading the script and started improvising.
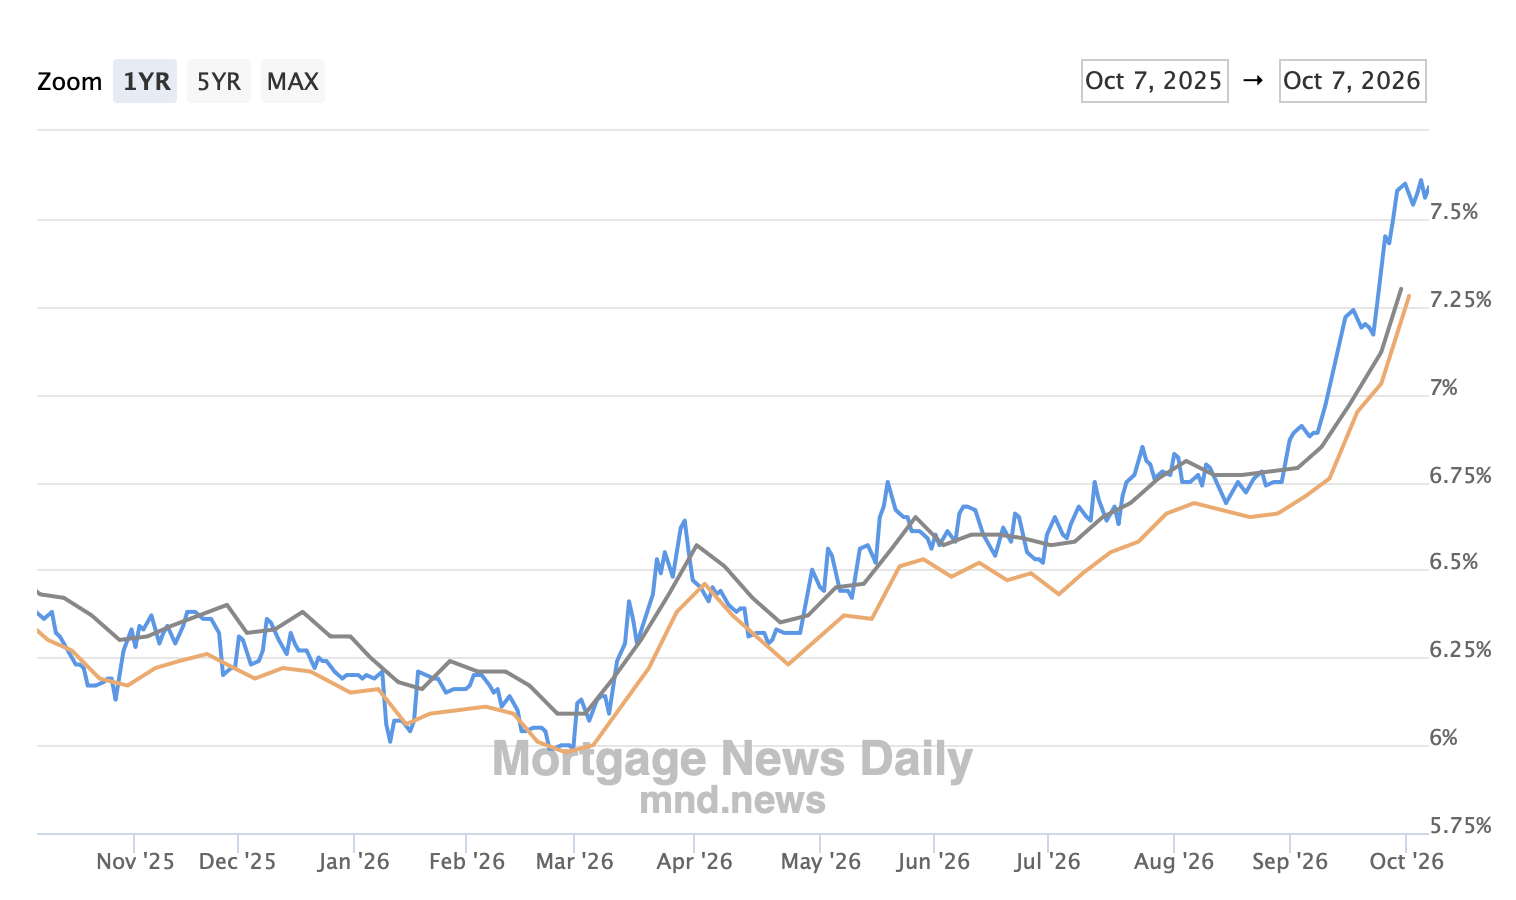
Freddie Mac’s weekly survey showed the average 30-year fixed rate rising from 6.76% on September 10 to 7.03% on September 24. Mortgage News Daily’s daily index ended September at 7.60%, compared with 6.37% one year earlier. The surveys use different methods, but both tell the same story: financing became more expensive during the month.
Here is what that looks like in Nolensville terms. On a $970,000 purchase with 20% down, moving from 6.37% to 7.60% increases the estimated principal-and-interest payment by roughly $640 per month, or about $7,700 per year. That illustration does not include property taxes, insurance, HOA dues, or loan-specific pricing, but it explains why buyers can love a house and still take a long pause before writing an offer.
That rate movement also helps explain the difference between September’s strong closing total and the softer late-month showing traffic. Closings told us what buyers decided several weeks earlier. Showings told us how shoppers were reacting as rates moved above 7%.
Nolensville Did Not Behave Like The Greater Nashville Average
You may have seen the headline that Nashville had become the strongest buyer’s market in the country. There is real data behind that statement, but geography matters.
Redfin estimated that the Nashville metropolitan area had 139% more sellers than buyers in August, the largest imbalance among the major markets it analyzed. That metro covers a far broader and more varied area than the Williamson County portion of Nolensville. A regional headline can be accurate while one premium, suburban, micro-market behaves very differently.
The September Greater Nashville numbers reinforce that distinction. Across the nine-county region, closings fell 2% year over year to 2,772. Active inventory rose 9%, average days on market increased to 37, and months of supply climbed to 5.28. The regional median sale price was $469,000.
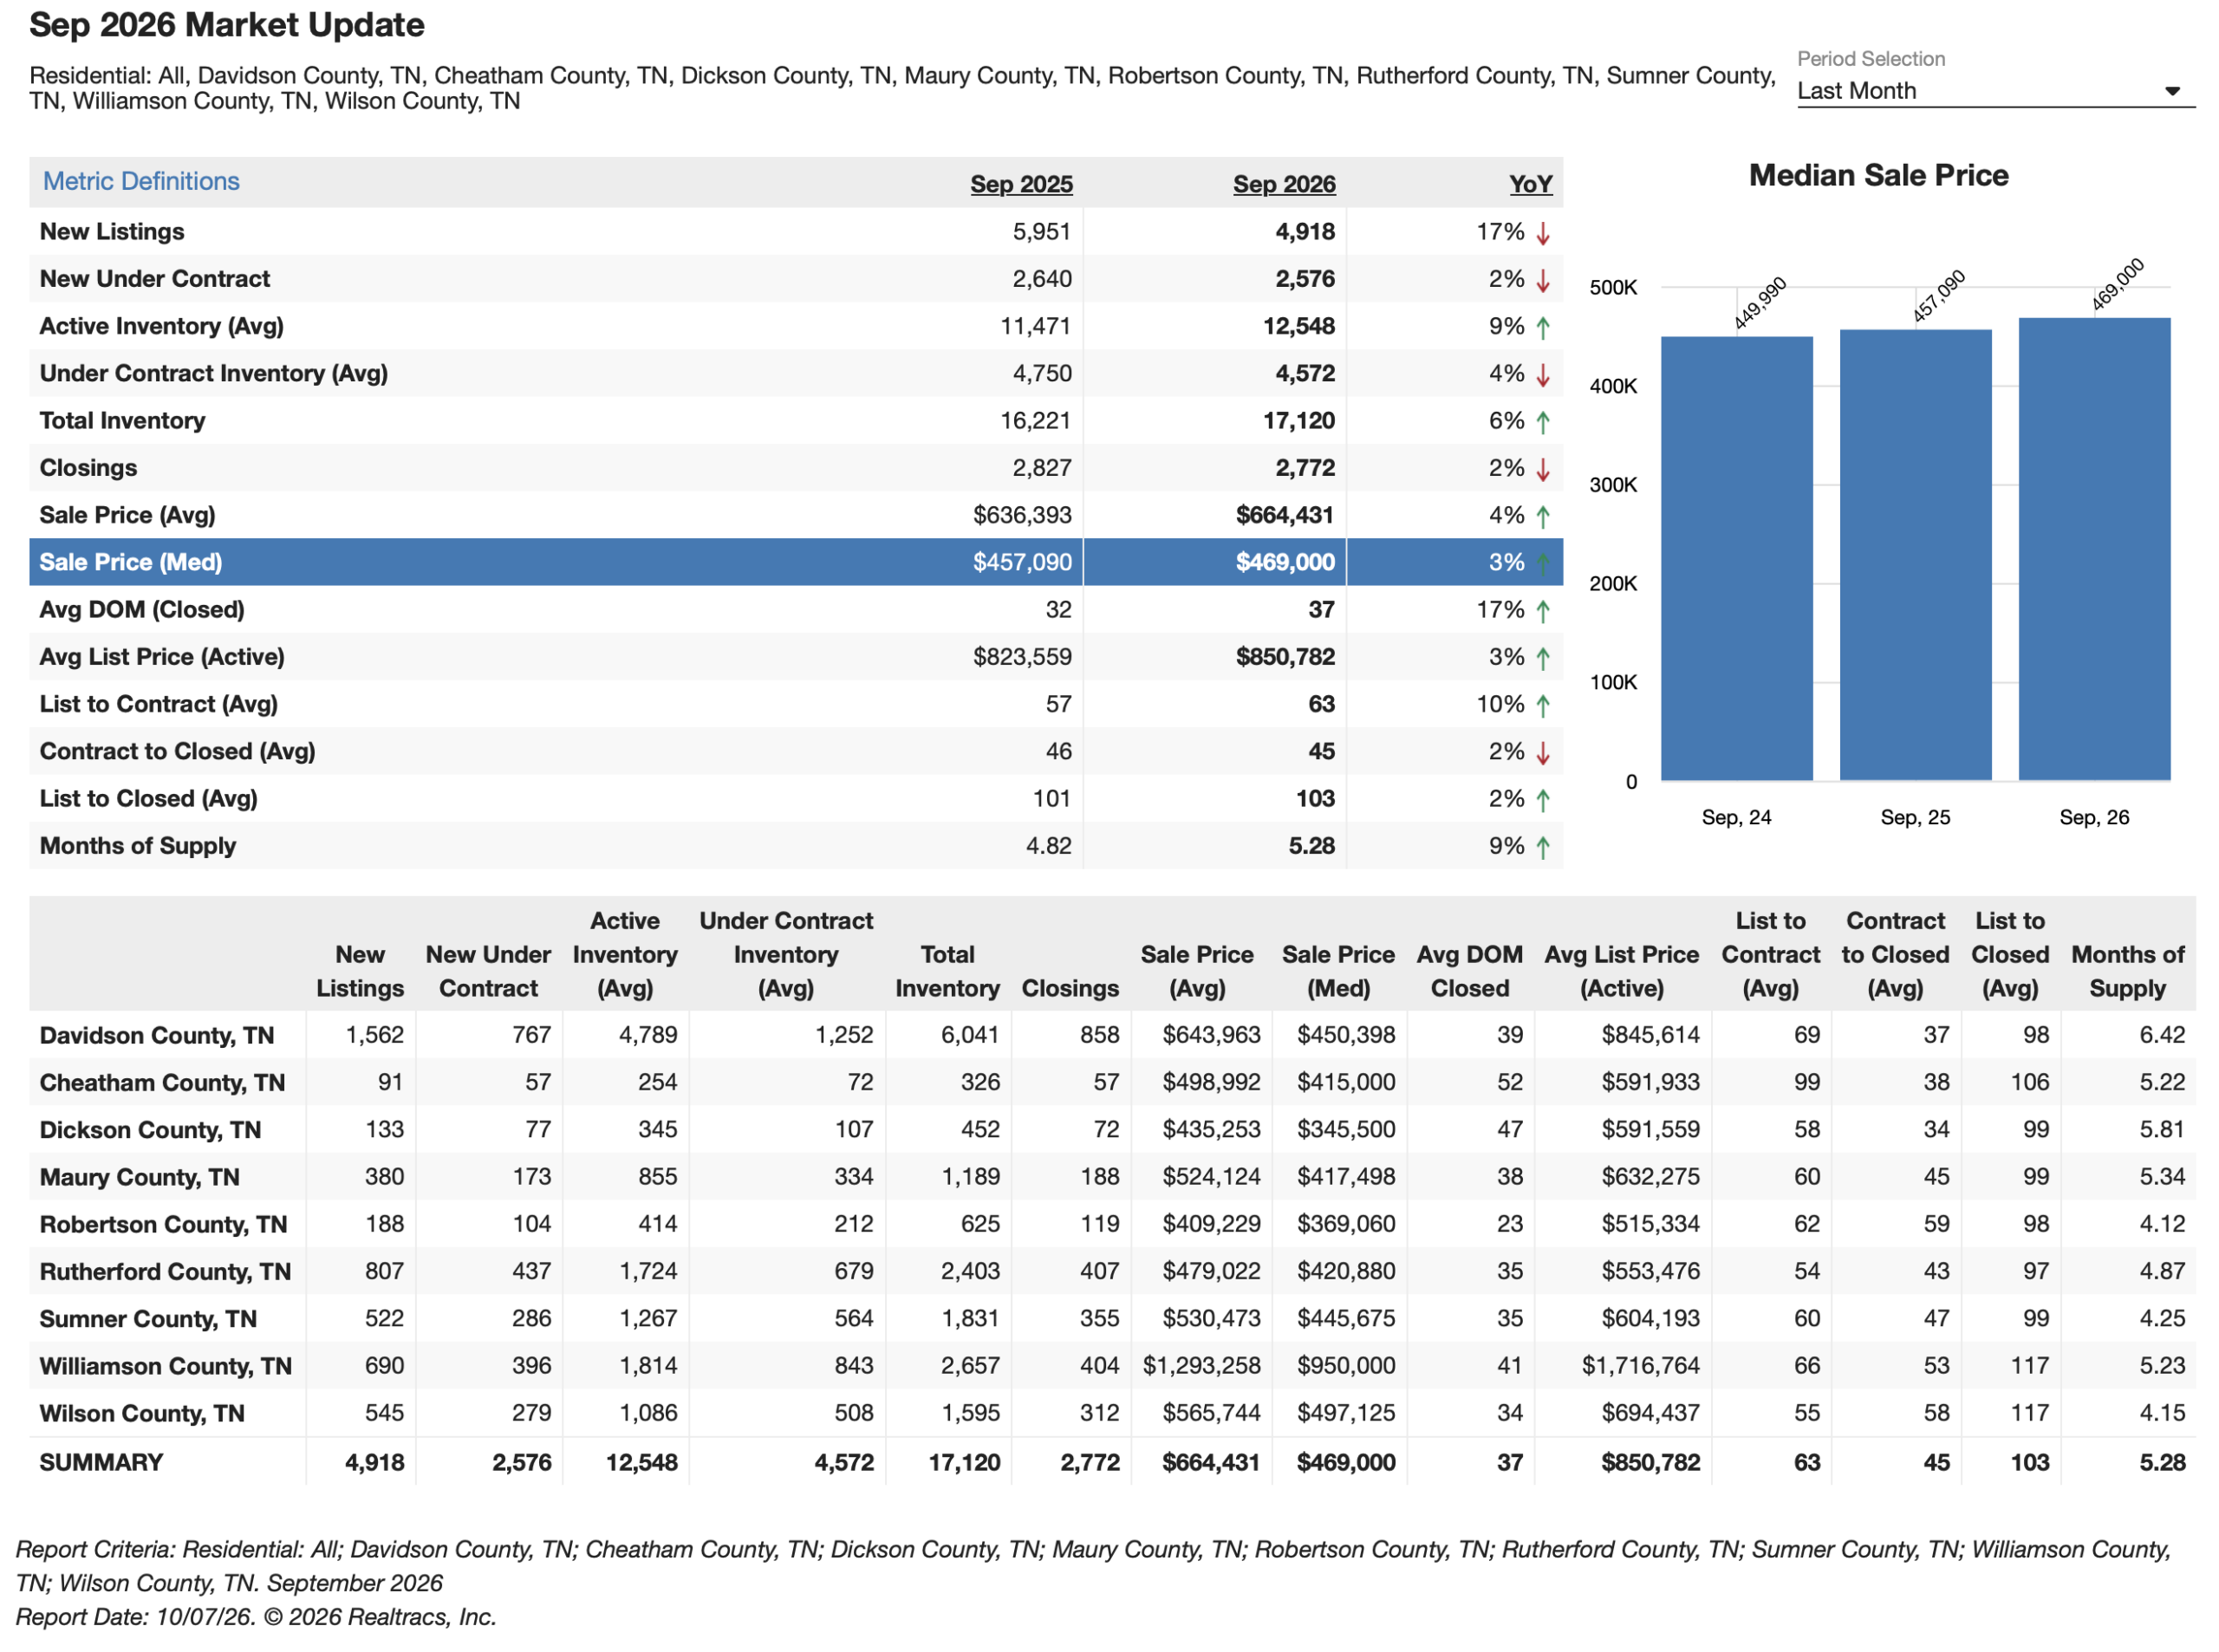
Nolensville, by comparison, posted a 110% increase in closings, 24 average days on market, 3.1 months of supply, and a $970,000 median sale price. The broader Nashville market gave buyers considerable leverage. Nolensville gave buyers more leverage than they had during the frenzy years, but not a blank check.
That is why real estate advice should get more local as the market becomes less uniform. “Nashville” is not one market. Neither is Williamson County. Price range, neighborhood, age, lot, condition, school zoning, and competition can all change the answer.
How Nolensville Compared With Williamson County
Williamson County recorded 404 closings in September, up 7% year over year. The countywide median sale price was $950,000, while the average reached $1,293,258. Active inventory increased 15%, average days on market rose to 41, and months of supply measured 5.23.
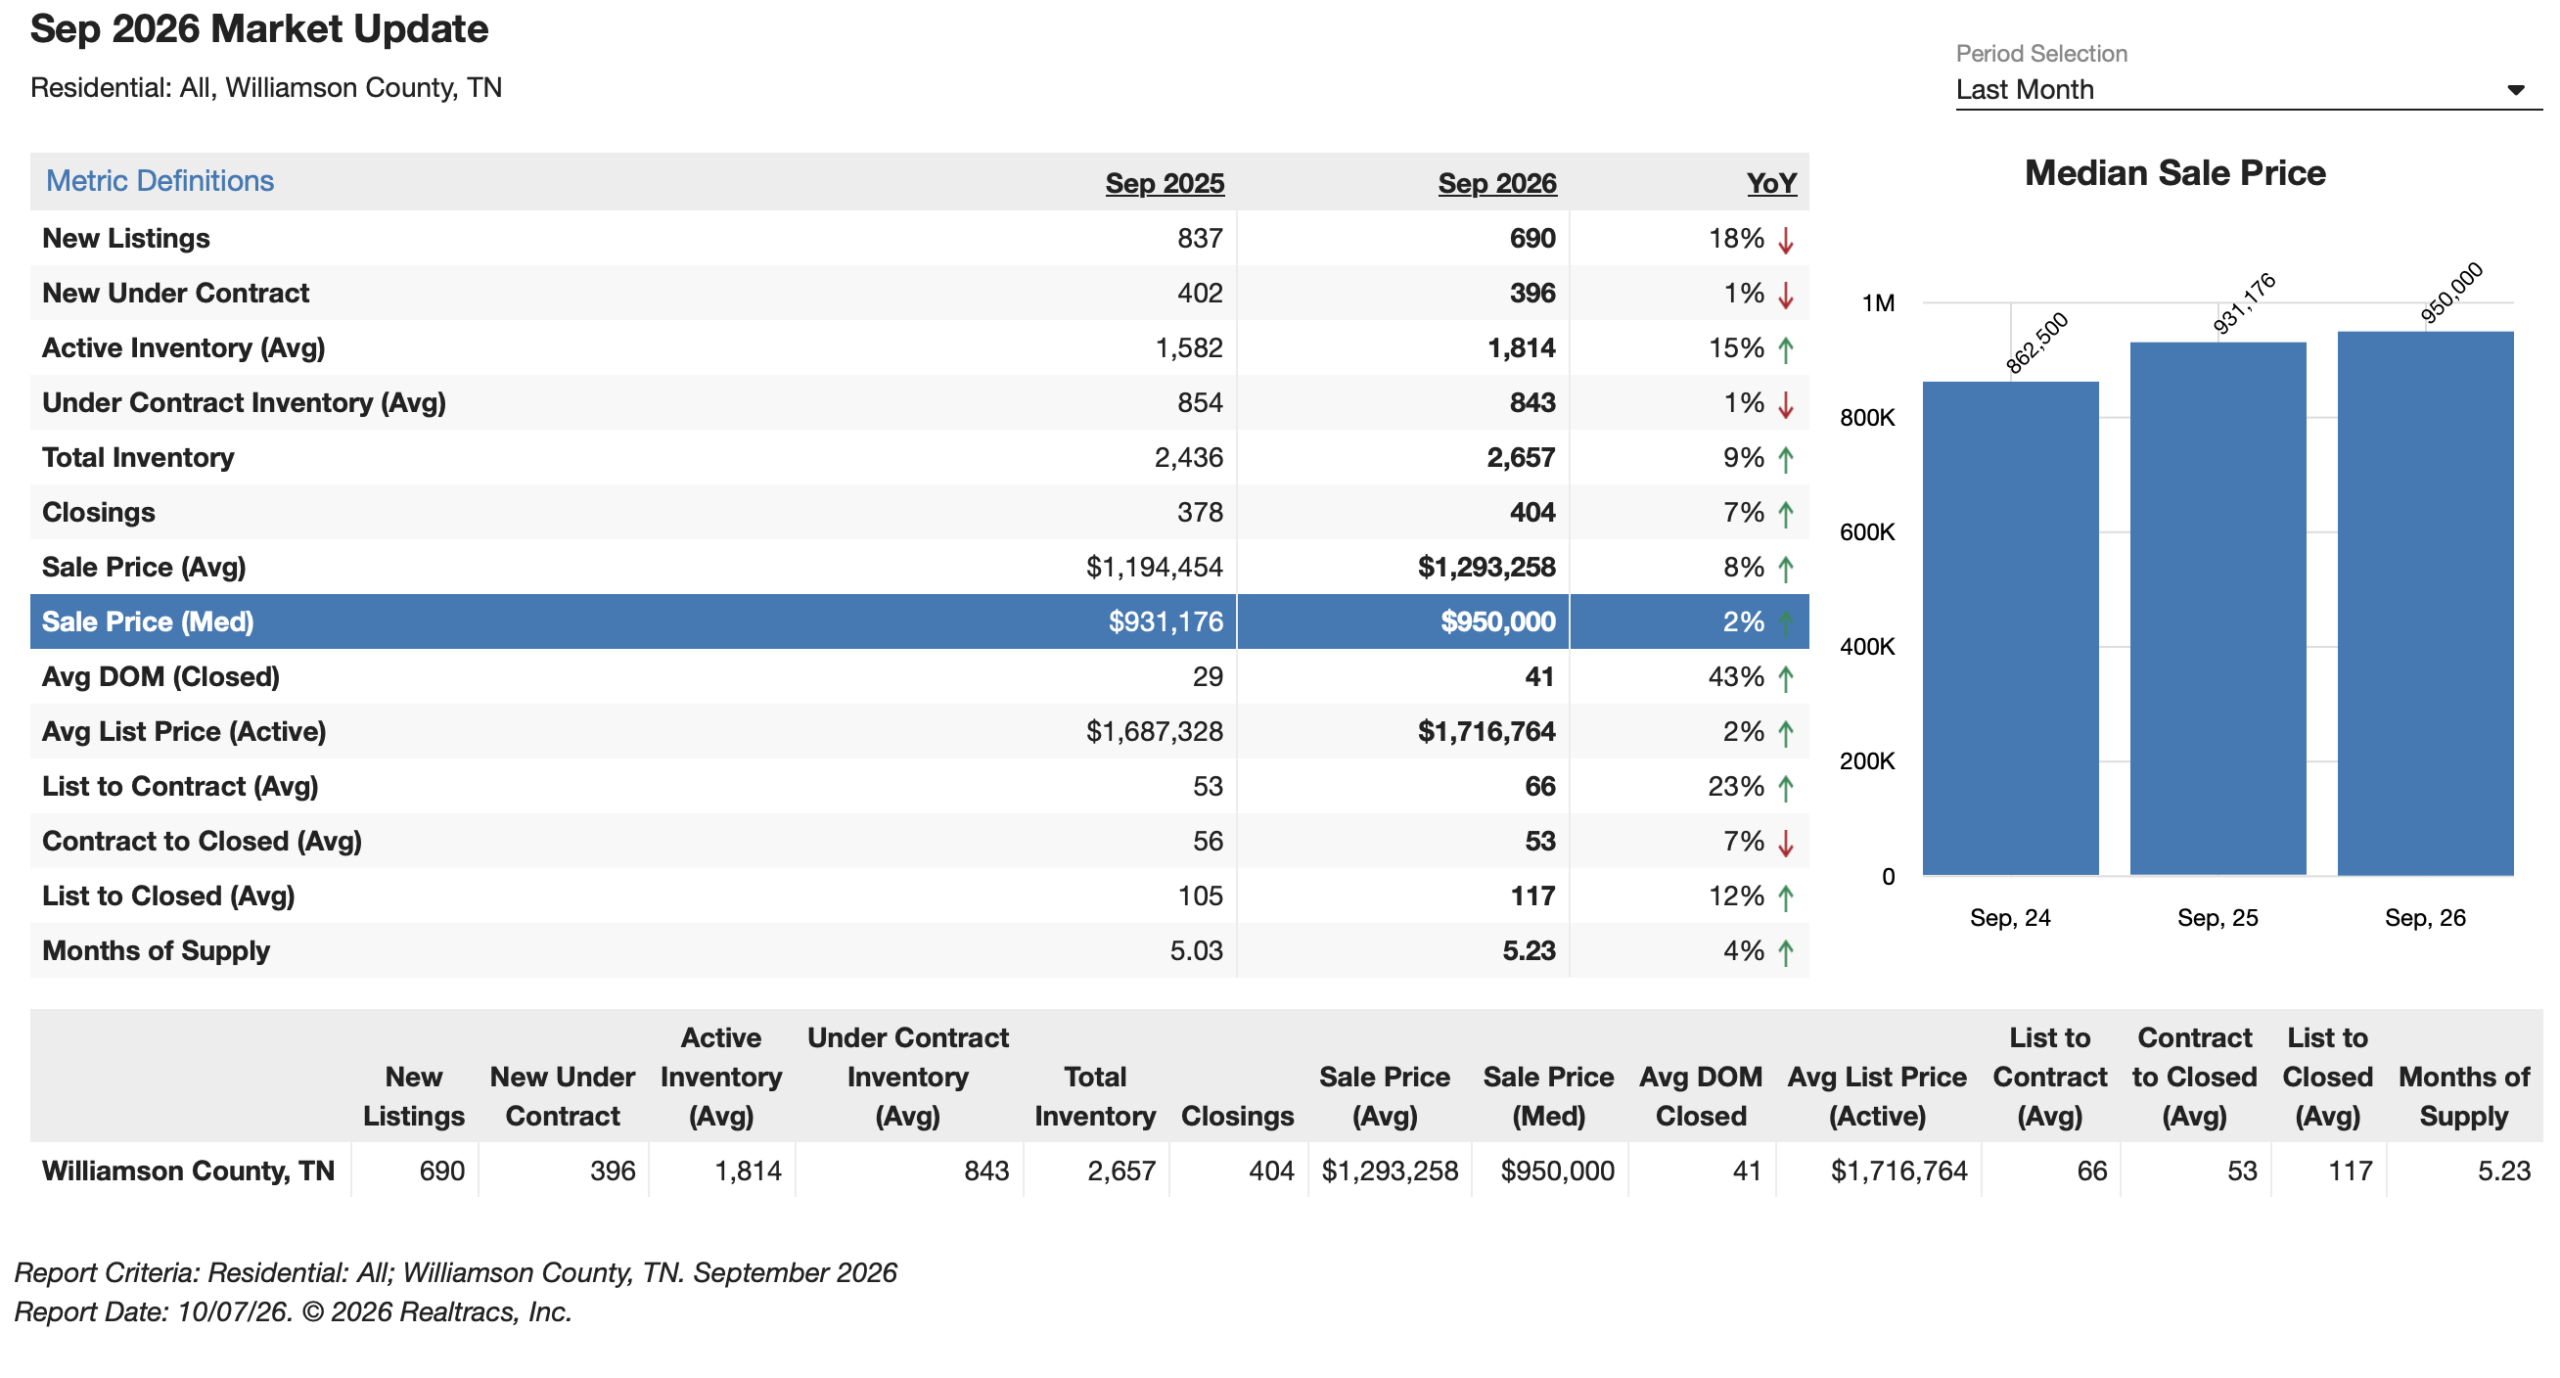
Nolensville’s $970,000 median was $20,000 above the county median, but its average price was lower because Williamson County also includes more ultra-luxury activity in places such as Brentwood and Franklin. The more important comparison is pace: Nolensville homes that closed moved faster, and local supply was considerably tighter than the countywide figure.
That does not guarantee every Nolensville listing will move quickly. It tells us the market had enough demand to reward the homes that matched what buyers wanted.
The National Market Was Softer Than Nolensville
Nationally, September was much less cheerful. Realtor.com reported that 20.8% of active listings had a price cut, the highest share in nearly four years. The stock of pending listings fell 4.1% year over year as mortgage rates moved above 7%. In the Nashville metro, Realtor.com measured active inventory 12% above last year, new listings down 2.4%, and 22.5% of listings with a price reduction.
The National Association of REALTORS reported that August existing-home sales fell 2% from July and national supply reached 4.9 months, its highest level in more than a decade. Against that backdrop, Nolensville’s September results stand out. Local prices rose, supply tightened, and closings accelerated even while the broader market was becoming more buyer-friendly.
Nolensville does not live inside a glass bubble. Higher rates, economic uncertainty, and national buyer psychology still matter here. But local fundamentals continue to matter more: Williamson County schools, newer housing stock, neighborhood quality, community identity, and access to Franklin, Brentwood, Nashville, and major employment centers.
What Nolensville Sellers Should Expect
September was encouraging for sellers. Supply tightened, homes that closed moved faster than last year, and buyers paid an average of 98.03% of final list price.
But this is not a market where a seller can price from memory, add a generous emotional premium, and assume buyers will sort it out later. Average active-listing showings declined in September, mortgage payments rose, and buyers can compare a resale home with new construction, builder incentives, and every competing listing from the couch.
The homes most likely to win are the ones that make sense immediately: the price matches the condition, the photos create a reason to schedule a showing, and the house feels as good in person as it looked online. A strong first week still matters. It just has to be earned.
If a listing misses on price or presentation, the market can be surprisingly quiet. The aggregate numbers may lean toward sellers, but buyers are not volunteering to rescue an ambitious asking price.
What Nolensville Buyers Should Expect
Buyers have more breathing room than they did a few years ago. Negotiations, inspection requests, seller-paid closing costs, and rate-buydown conversations are all part of today’s market. That is especially true for listings that have been available for a while or face strong competition from nearby homes.
At the same time, 3.1 months of supply and 24 average days on market are reminders that Nolensville is not the same as the broad Nashville metro headline. A well-priced home in a desirable neighborhood can still move before a buyer finishes debating paint colors.
The best approach is to be prepared without being panicked. Know your payment range, understand how a rate change affects it, and be ready to act when the right property appears. Patience is useful. Hesitation on the right house can still be expensive.
Nolensville Real Estate Seasonality: What Should We Expect for the Rest of 2026?
Real estate does not suddenly fall off a cliff when the kids return to school, but the market does tend to change gears. Looking at residential closings in the Williamson County portion of Nolensville from 2021 through 2025, spring and summer were clearly the busiest seasons. Monthly closings averaged approximately 41 from March through August, compared with just under 32 from September through December… a typical seasonal decline of roughly 22%.
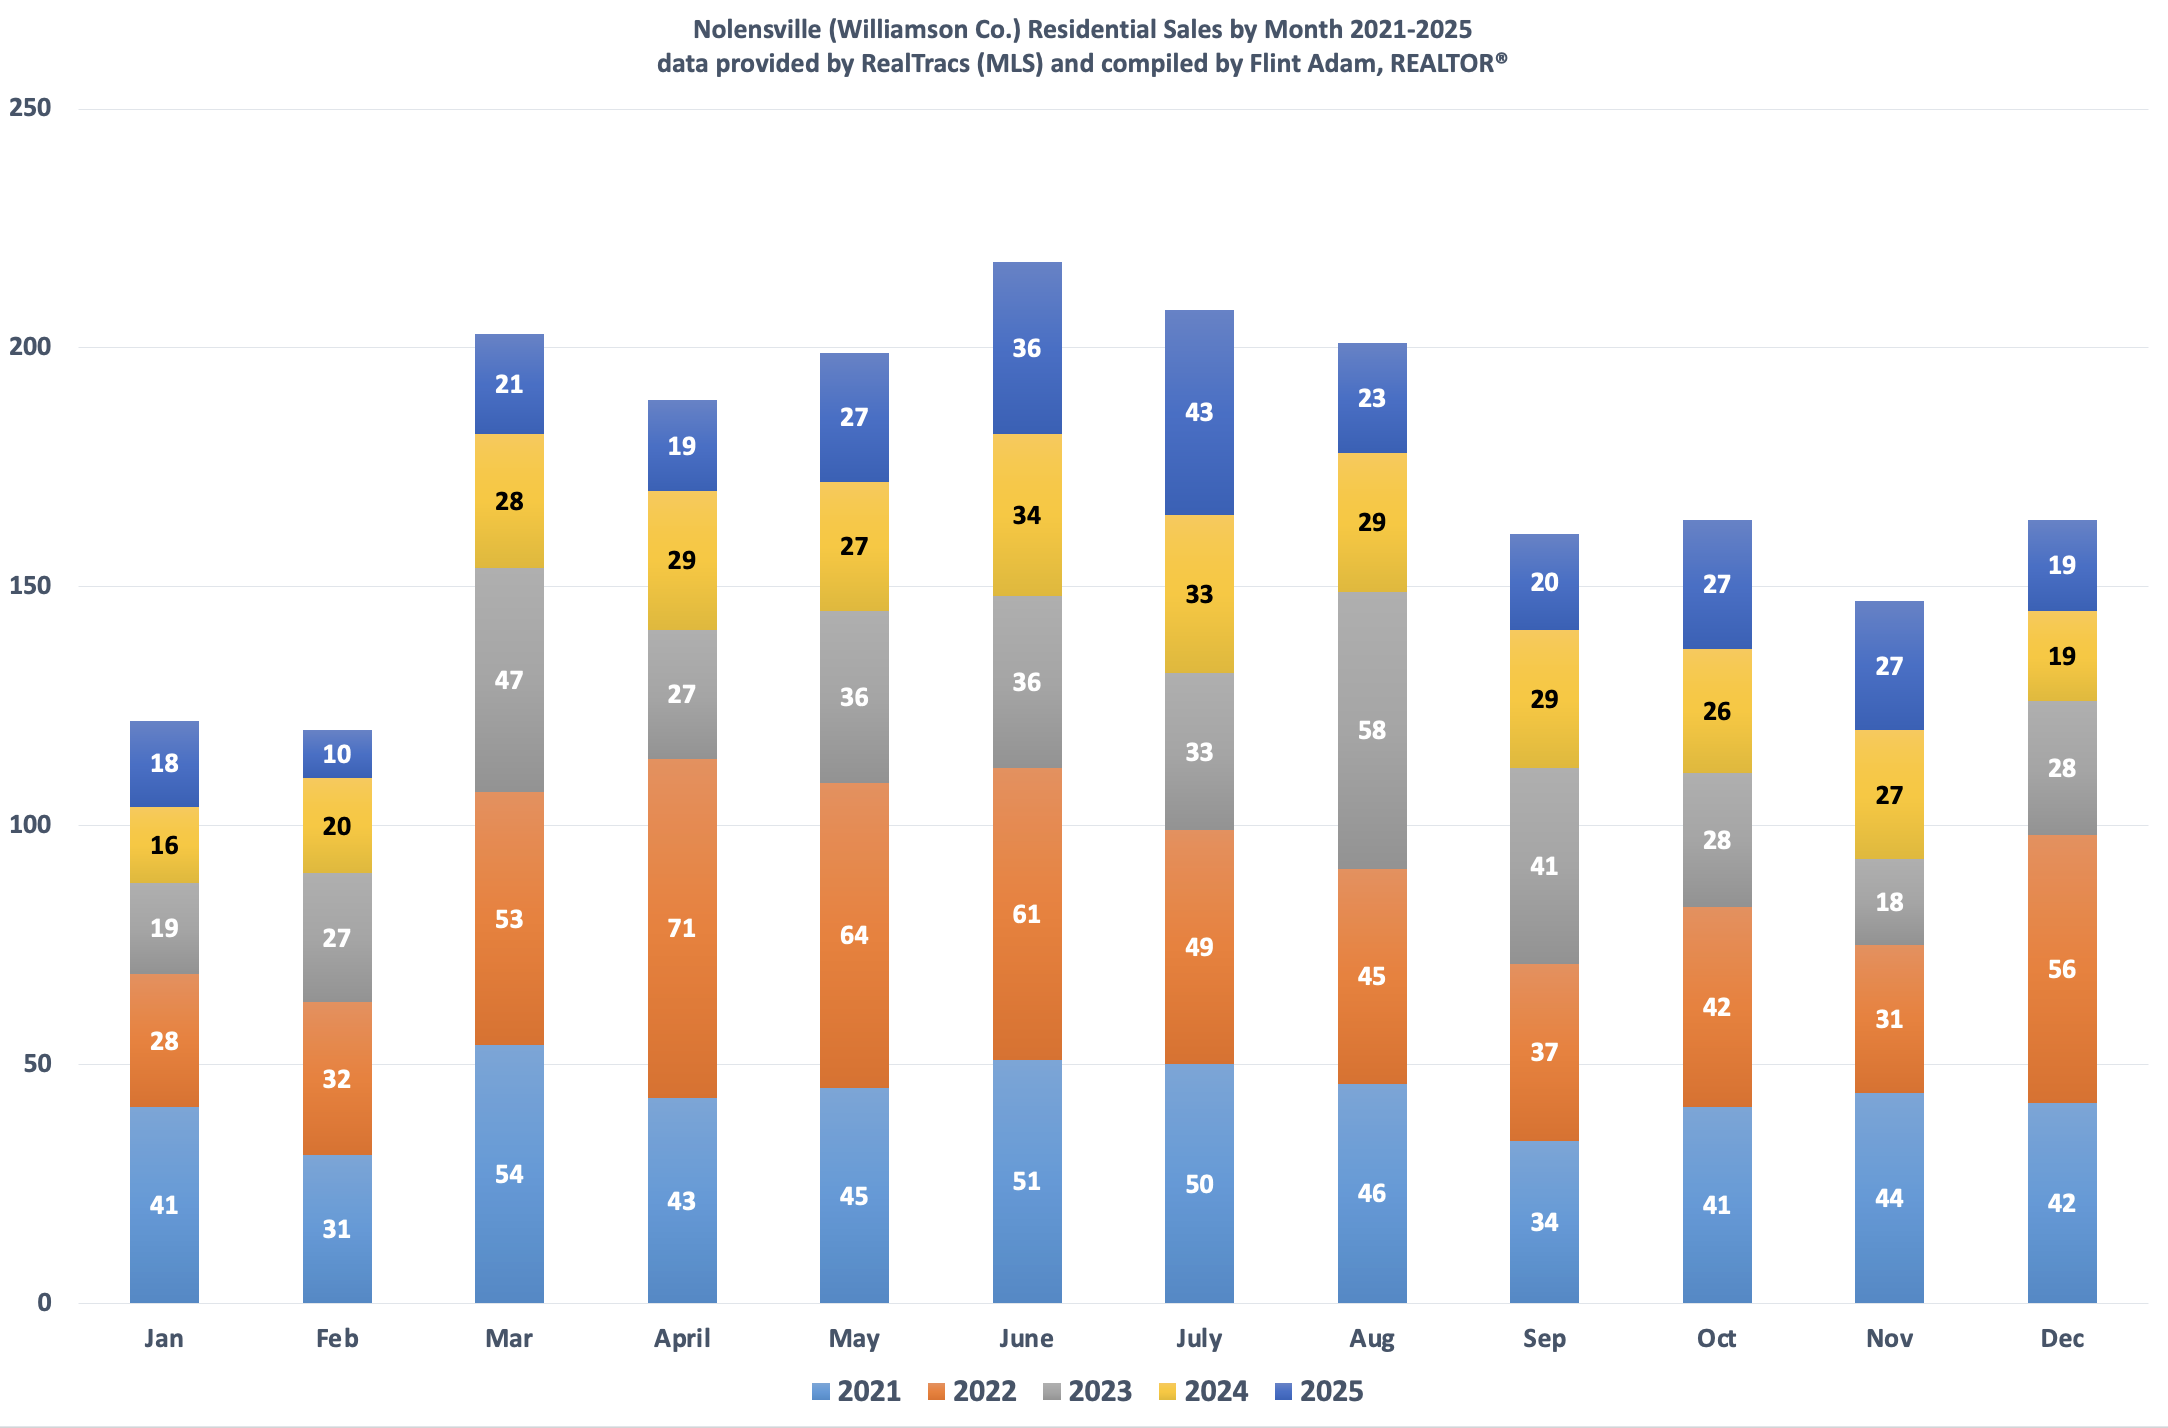
The encouraging news is that September 2026 apparently did not get the memo. Nolensville recorded 42 closings during the month. That was more than double September 2025’s total, approximately 30% above the five-year September average of 32 closings, and higher than any September shown on this chart. The calendar may have said fall, but closing activity looked much more like the heart of the spring and summer market.
So, what normally happens next? October has historically held up surprisingly well, averaging 32.8 closings over the past five years… virtually identical to September’s average of 32.2. November has typically been the quietest remaining month, averaging 29.4 closings, before activity has rebounded to an average of 32.8 closings in December.
Taken together, the fourth quarter has averaged approximately 95 Nolensville closings per year, about 17% fewer than the third quarter’s average of 114. The market usually cools modestly as we approach the holidays, but it certainly does not shut down. There may be fewer casual buyers wandering through open houses, but the people who remain active are often the ones with a real reason to move.
It is also worth remembering that closings are a rearview-mirror statistic. With September’s average contract-to-closing period running around 40 days, much of October’s closing activity was set in motion during August and September. Mortgage rates, available inventory, and consumer confidence can always disrupt the usual seasonal pattern, so these averages should be viewed as a guide… not a crystal ball.
Based on the five-year pattern, I would expect October to remain reasonably active, November to feel quieter and December to have the potential for a modest year-end rebound. For sellers, the fall market places even more importance on accurate pricing, strong presentation and making a good first impression. Buyers, meanwhile, may encounter fewer competing offers and more negotiating opportunities, although they will usually have fewer homes from which to choose.
The Nolensville market is not closing for the season, it is simply trading its flip-flops for a light jacket.
Frequently Asked Questions About The Nolensville Housing Market
Does The Nolensville Market Favor Buyers Or Sellers
Based on September’s 3.1 months of supply, Nolensville leaned toward sellers overall. Buyers still had negotiating opportunities, especially on homes that were overpriced, dated, or sitting longer, but the local market was considerably tighter than Williamson County and Greater Nashville as a whole.
What Was The Median Home Price In Nolensville In September 2026
The median sale price in the Williamson County portion of Nolensville was $970,000, up 3% from September 2025. The average sale price was $1,094,032, boosted in part by 18 closings at $1 million or more.
How Many Homes Sold In Nolensville In September 2026
There were 42 residential closings in the Williamson County portion of ZIP code 37135, up 110% from the 20 closings recorded in September 2025.
How Long Did Nolensville Homes Take To Sell
Homes that closed in September averaged 24 days on market, down from 35 days a year earlier. Individual results varied widely based on price, condition, location, competition, and whether a home was new construction.
Are Nolensville Home Prices Falling
Not in the September year-over-year data. The median sale price rose 3%, the average rose 8%, and the median price per square foot reached $307. Monthly figures can move with the mix of homes sold, so neighborhood-level and price-range comparisons remain more useful for evaluating a specific property.
Is Now A Good Time To Buy Or Sell A Home In Nolensville
That depends on the property and the person. Sellers benefited from tighter local supply, but pricing and presentation mattered. Buyers had more negotiating room than during the peak frenzy, but higher mortgage rates reduced purchasing power. The right answer should be based on your timeline, payment comfort, equity position, neighborhood, and the competition in your exact price range.
My Read On The Nolensville Market
September was a stronger month than most people would guess from the national housing headlines.
Closings surged. Prices held firm. Inventory tightened. Homes that made it to the closing table moved faster than they did a year ago. Those are meaningful positives.
The caution is in the forward-looking data. Mortgage rates climbed, average showings fell, and new contract activity remained well below the spring pace even though it improved from last year. That tells me the market is active, not effortless.
For sellers, the opportunity is real, but the margin for error is small. For buyers, the market is more approachable, but the best homes are still capable of moving quickly. For both sides, the details matter more than the headline.
And that may be the most honest description of Nolensville real estate in September 2026: strong local fundamentals, selective buyers, tighter supply, and one very uncooperative mortgage-rate chart.
 If you are thinking about buying or selling a home in Nolensville, I would be happy to help you understand what these numbers mean for your specific situation.
Give me a call or text at 615-500-6393, or email me at flint@theguidehome.com.
Interested in up-to-date Nolensville TN real estate sales figures? I can email you an hourly updated look at Nolensville real estate activity, including what has gone pending, price-reduced, and withdrawn. Just send me your name and preferred email address.