


After a very encouraging spring, the June 2026 Nolensville real estate numbers gave us a slightly different flavor.
Not bad. Not scary. Not “hide under the desk and wait for 2021 to come back.” But definitely a little more complicated.
April gave us a big rebound. May confirmed that the rebound had some staying power. June showed us that the Nolensville housing market is still active, but buyers are becoming even more thoughtful, more selective, and more price-aware as we move into the summer months.
That is not necessarily a bad thing.
In fact, this is the kind of market where good homes still sell, serious buyers still buy, and homeowners still have plenty of opportunity… but strategy matters more than it did just a few months ago.
The best, short description of the June 2026 Nolensville real estate market: still healthy, more balanced, and very selective.
Note: The information below cites Williamson County sales data for Nolensville, Tennessee. There is, of course, a small percentage of Nolensville homes that exist in Davidson and Rutherford counties, but for continuity in my blogging, I reference only Williamson County statistics.
June 2026 Nolensville Real Estate Market Snapshot
Here are the headline numbers for the Williamson County portion of Nolensville in June 2026:
- 31 home closings, down 14% from June 2025
- 36 homes went under contract, up 20% year-over-year
- 52 new listings, down 10% year-over-year
- 107 average active listings, up 12% year-over-year
- 185 total homes in inventory, up 19% year-over-year
- $901,500 median sale price, down 4% year-over-year
- $988,720 average sale price, down 3% year-over-year
- 34 average days on market, up from 21 days last June
- 4.16 months of supply, up 13% from June 2025
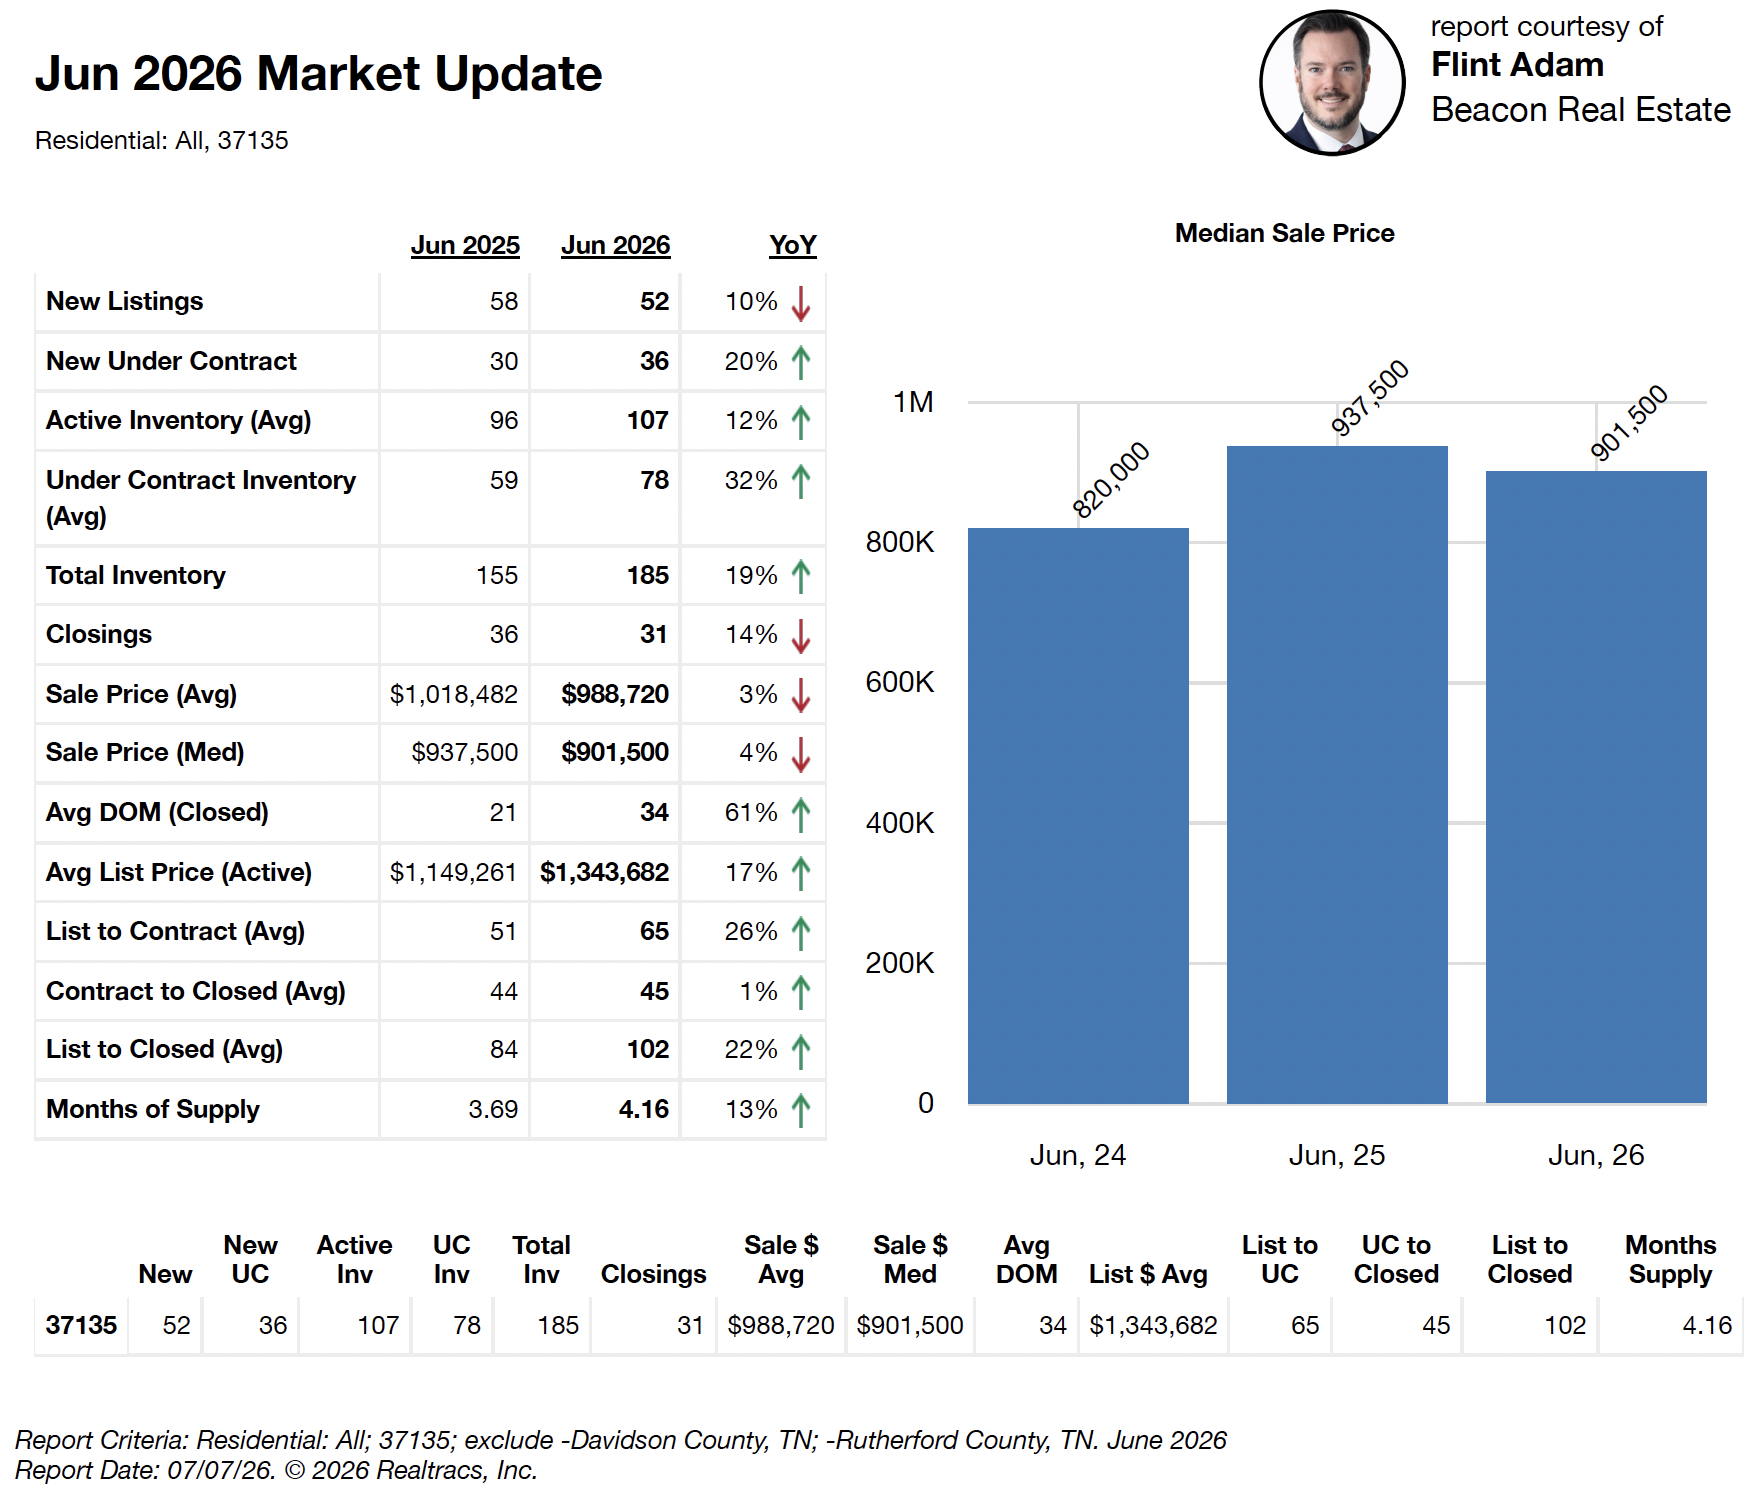
At first glance, it would be easy to focus on the fact that closings and prices were down compared to last June. But that does not tell the whole story. The more important number may be this: new under-contract activity was up 20% year-over-year.
That tells us buyers did not disappear in June. They were still out there, they were still writing contracts, and they were still choosing homes in Nolensville.
They were just doing it more carefully.
The Spring Surge Took A Breather
In my May market report, I described the Nolensville market as “healthy, active, and selective.” That still applies, but June added a little more emphasis to the “selective” part.
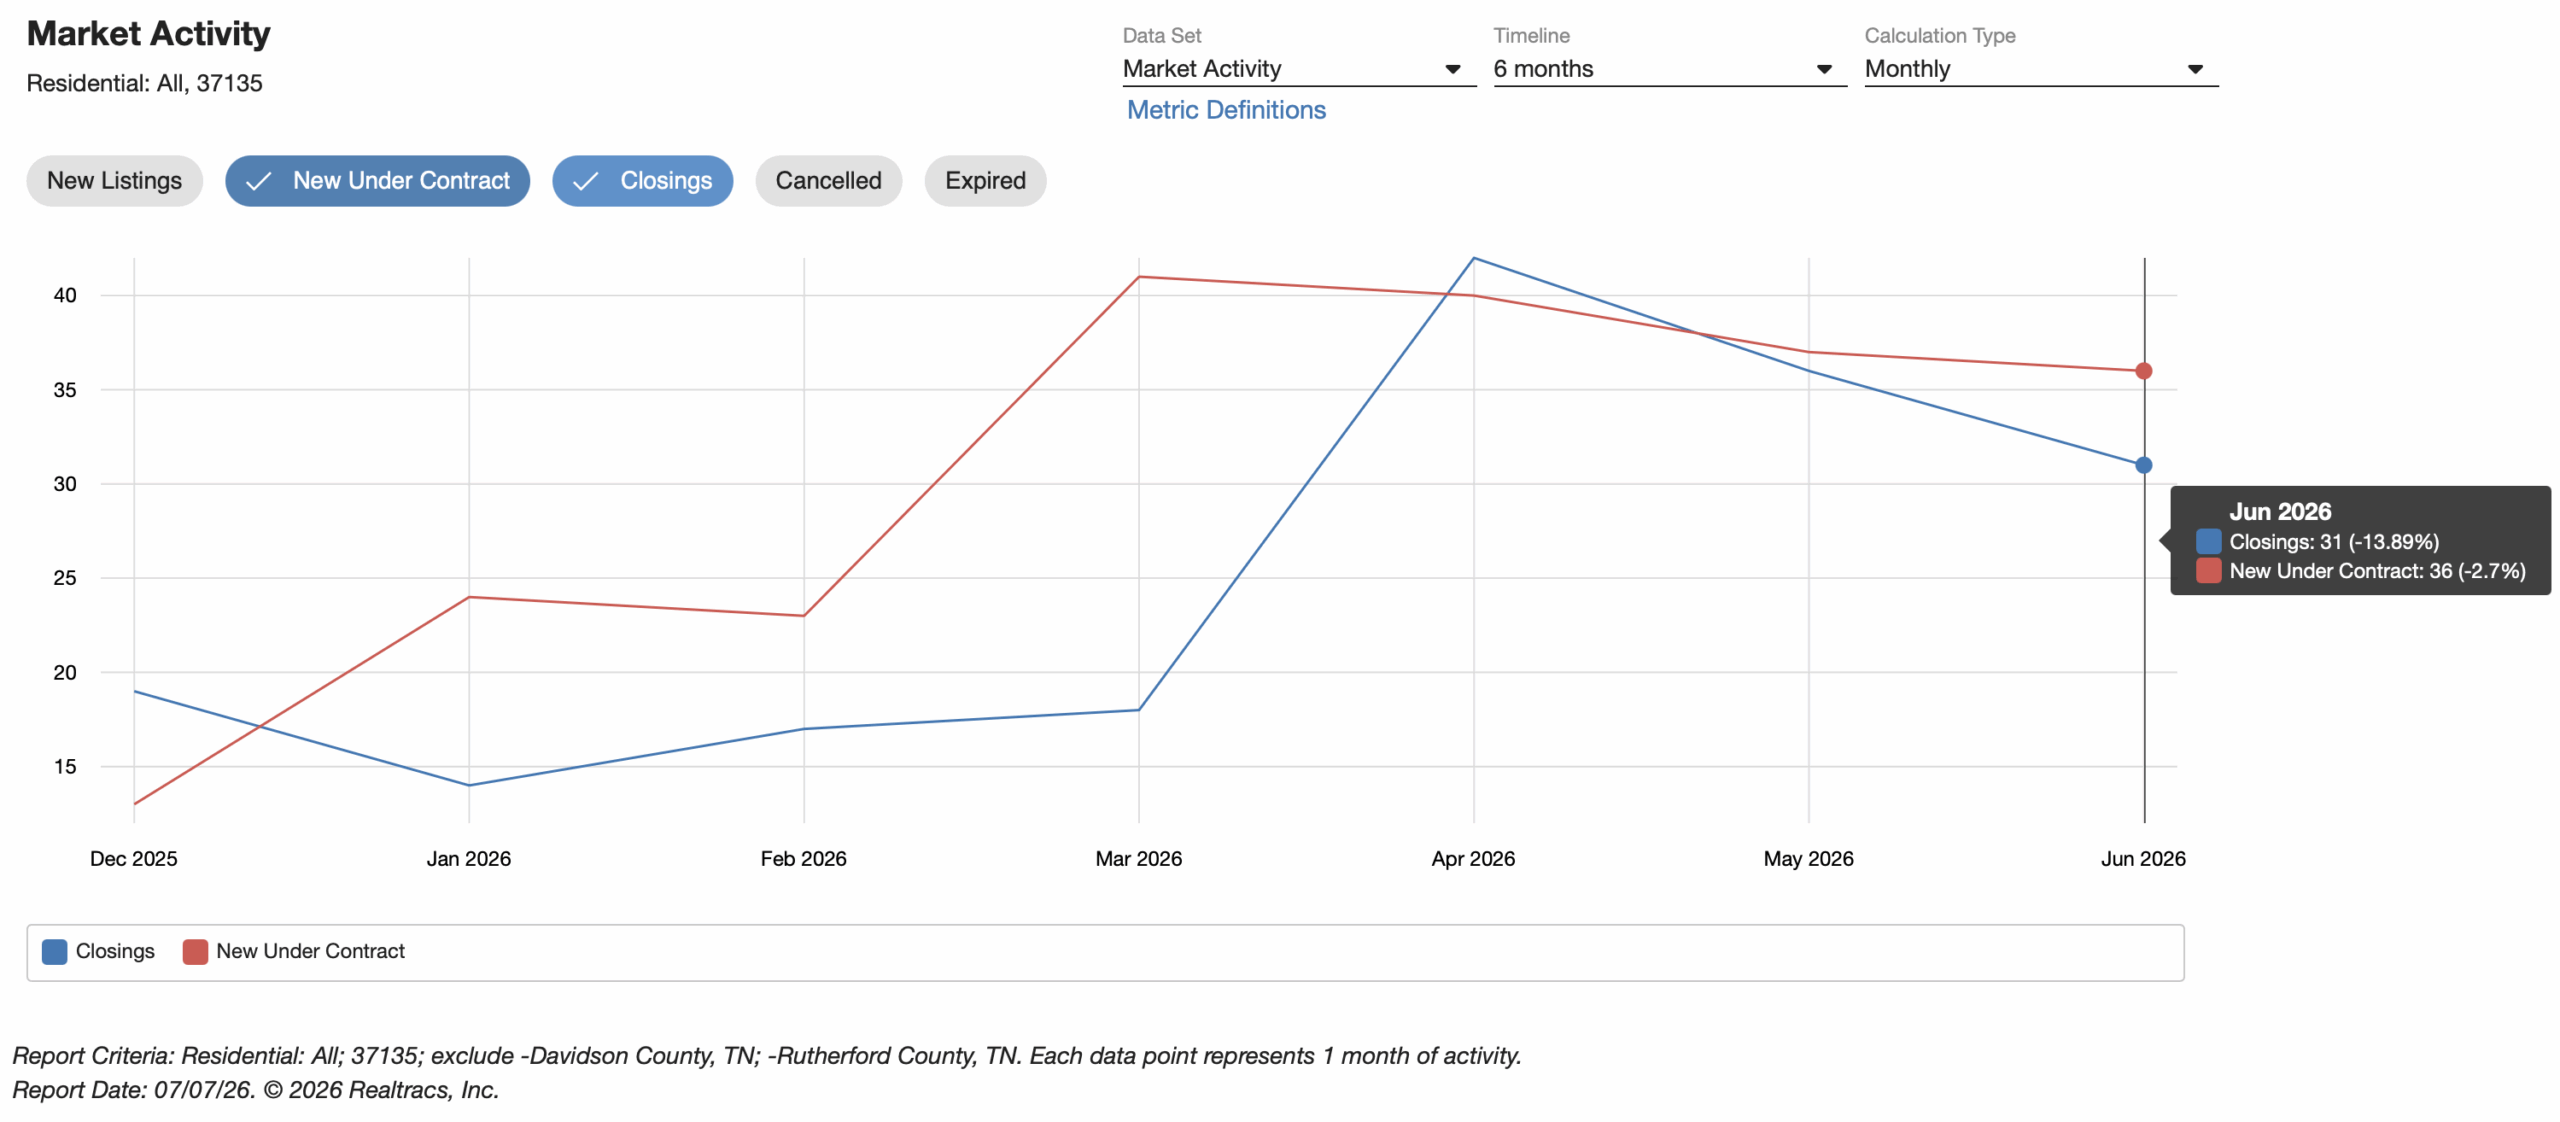
The spring rebound was very real. After only 14 closings in January, 17 in February, and 18 in March, Nolensville jumped to 42 closings in April and 36 in May.
June came in at 31 closings.
So yes, the closing pace cooled compared to April and May, but we should not confuse a cooler month with a frozen market.
Closings are a lagging indicator. They usually reflect contracts written 30 to 45 days earlier. New under-contract activity gives us a better sense of what buyers are doing right now. And in June, 36 homes went under contract in the Williamson County portion of Nolensville, compared to 30 in June 2025.
That is a 20% year-over-year increase!
For a month where closings were down, that contract number is extremely important. It suggests the market did not lose buyer interest. Instead, June looked more like a transition from the hotter spring pace into a steadier, more measured summer market.
In other words, the market did not fall off the horse. It just stopped galloping.
Year-To-Date Demand Is Still Ahead Of 2025
One of the best ways to understand a smaller, local market like Nolensville is to zoom out and look beyond a single month.
Monthly numbers can jump around. A few extra luxury closings can move the average sale price. A handful of delayed closings can make one month look weaker than it really is. That is why year-to-date trends are so helpful.
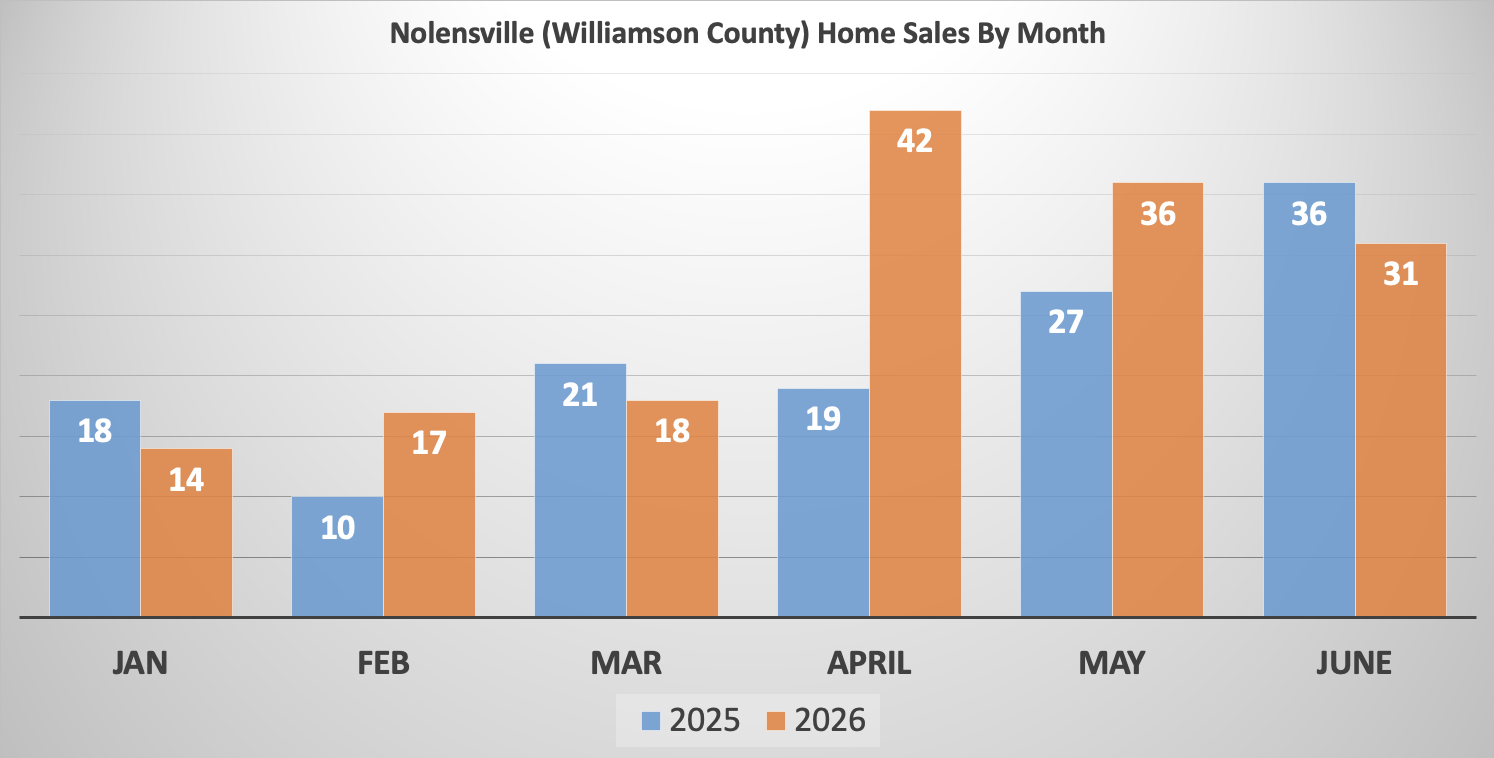
Through the first six months of 2026, the Williamson County portion of Nolensville recorded 158 closed sales, compared to 131 closings during the same period in 2025.
That is roughly a 21% increase in closed sales year-to-date.
Even more interesting, Nolensville has recorded approximately 204 new contracts through June, compared to 152 during the same period last year.
That is roughly a 34% increase in new under-contract activity.
Meanwhile, new listing activity is basically flat. Nolensville has had about 333 new listings through June 2026 compared to 331 through June 2025.
That is a very important piece of the puzzle.
Buyer activity is running well ahead of last year, while new listing activity is almost unchanged. That tells me demand is still present, even if buyers are behaving differently than they did during the wild market of a few years ago.
The issue is not that buyers no longer want Nolensville – they do!
The issue is that buyers are more cautious about price, condition, mortgage payment, and value.
Inventory Is Higher, But Not Out Of Control
Inventory continues to be one of the biggest stories in the Nolensville housing market.
In June, active inventory averaged 107 homes, up 12% from last June. Total inventory reached 185 homes, up 19% year-over-year.
That means buyers have more choices.
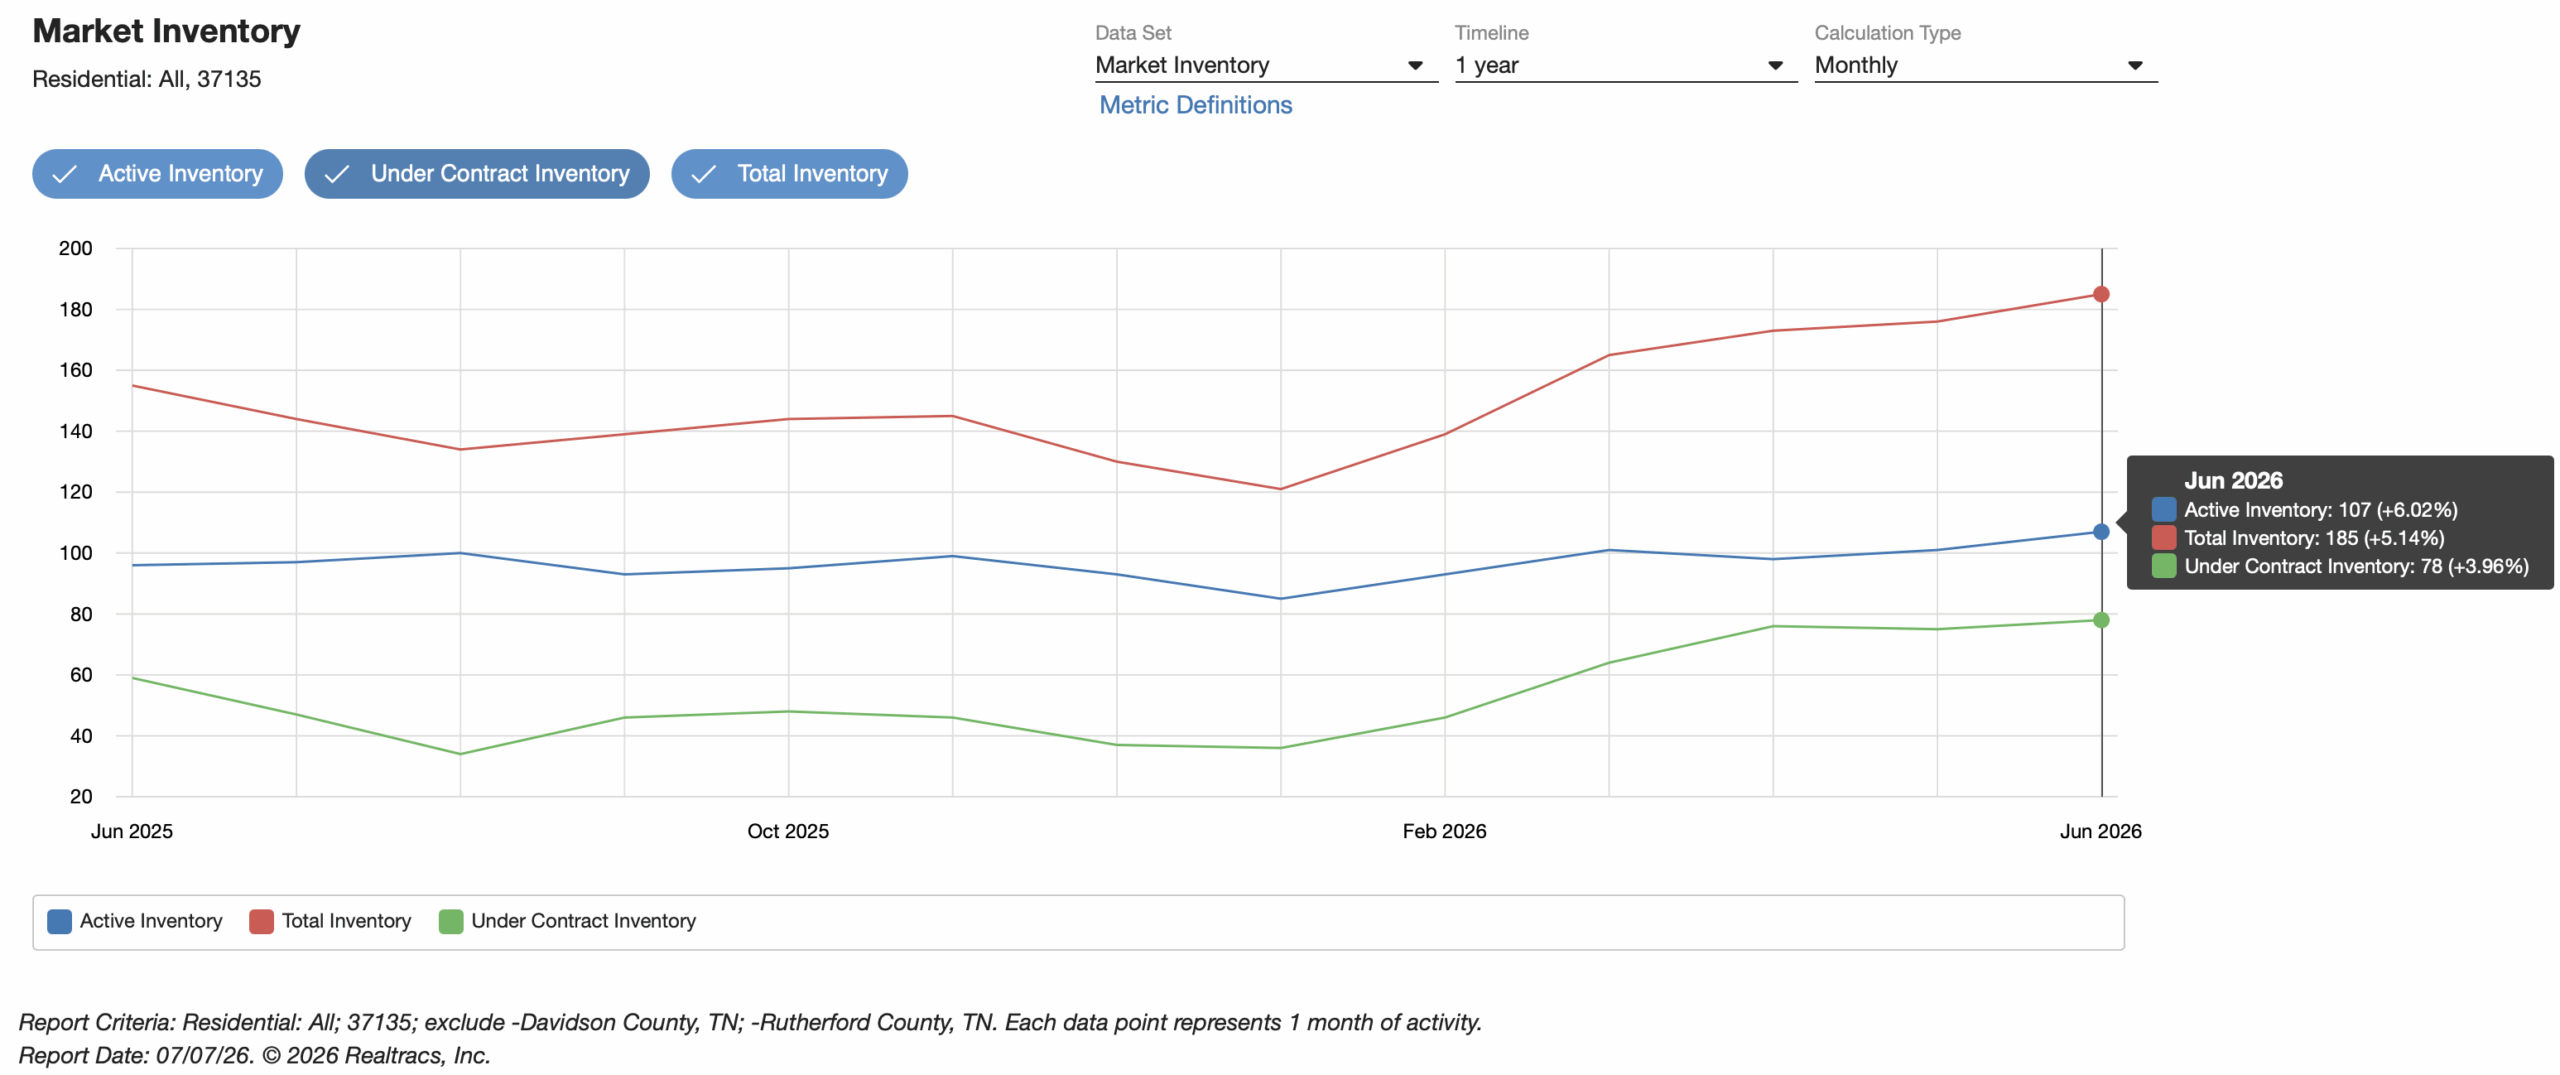
For sellers who remember the days when there seemed to be almost nothing available, this can feel like a dramatic shift. But it is important to keep this in perspective: more inventory does not automatically mean too much inventory.
June’s months of supply came in at 4.16 months. That is up from 3.69 months last June and higher than the 3.56 months we saw in May. So, yes, the market loosened a bit.
But 4.16 months of supply is not an oversupplied market. It is closer to balanced.
For context, the Greater Nashville region posted 4.52 months of supply in June, while Williamson County came in at 3.78 months. Nolensville sits right between the two: a little looser than Williamson County overall, but still tighter than the broader Greater Nashville market.
That makes sense.
Nolensville is no longer an ultra-tight seller’s market where every listing automatically receives immediate attention. But it is also not a market where buyers can simply name their price and expect sellers to surrender.
The market has room for negotiation, but not room for nonsense.
Nolensville Home Prices Pulled Back In June
June’s median sale price in the Williamson County portion of Nolensville was $901,500, down 4% from June 2025.
The average sale price was $988,720, down 3% year-over-year.
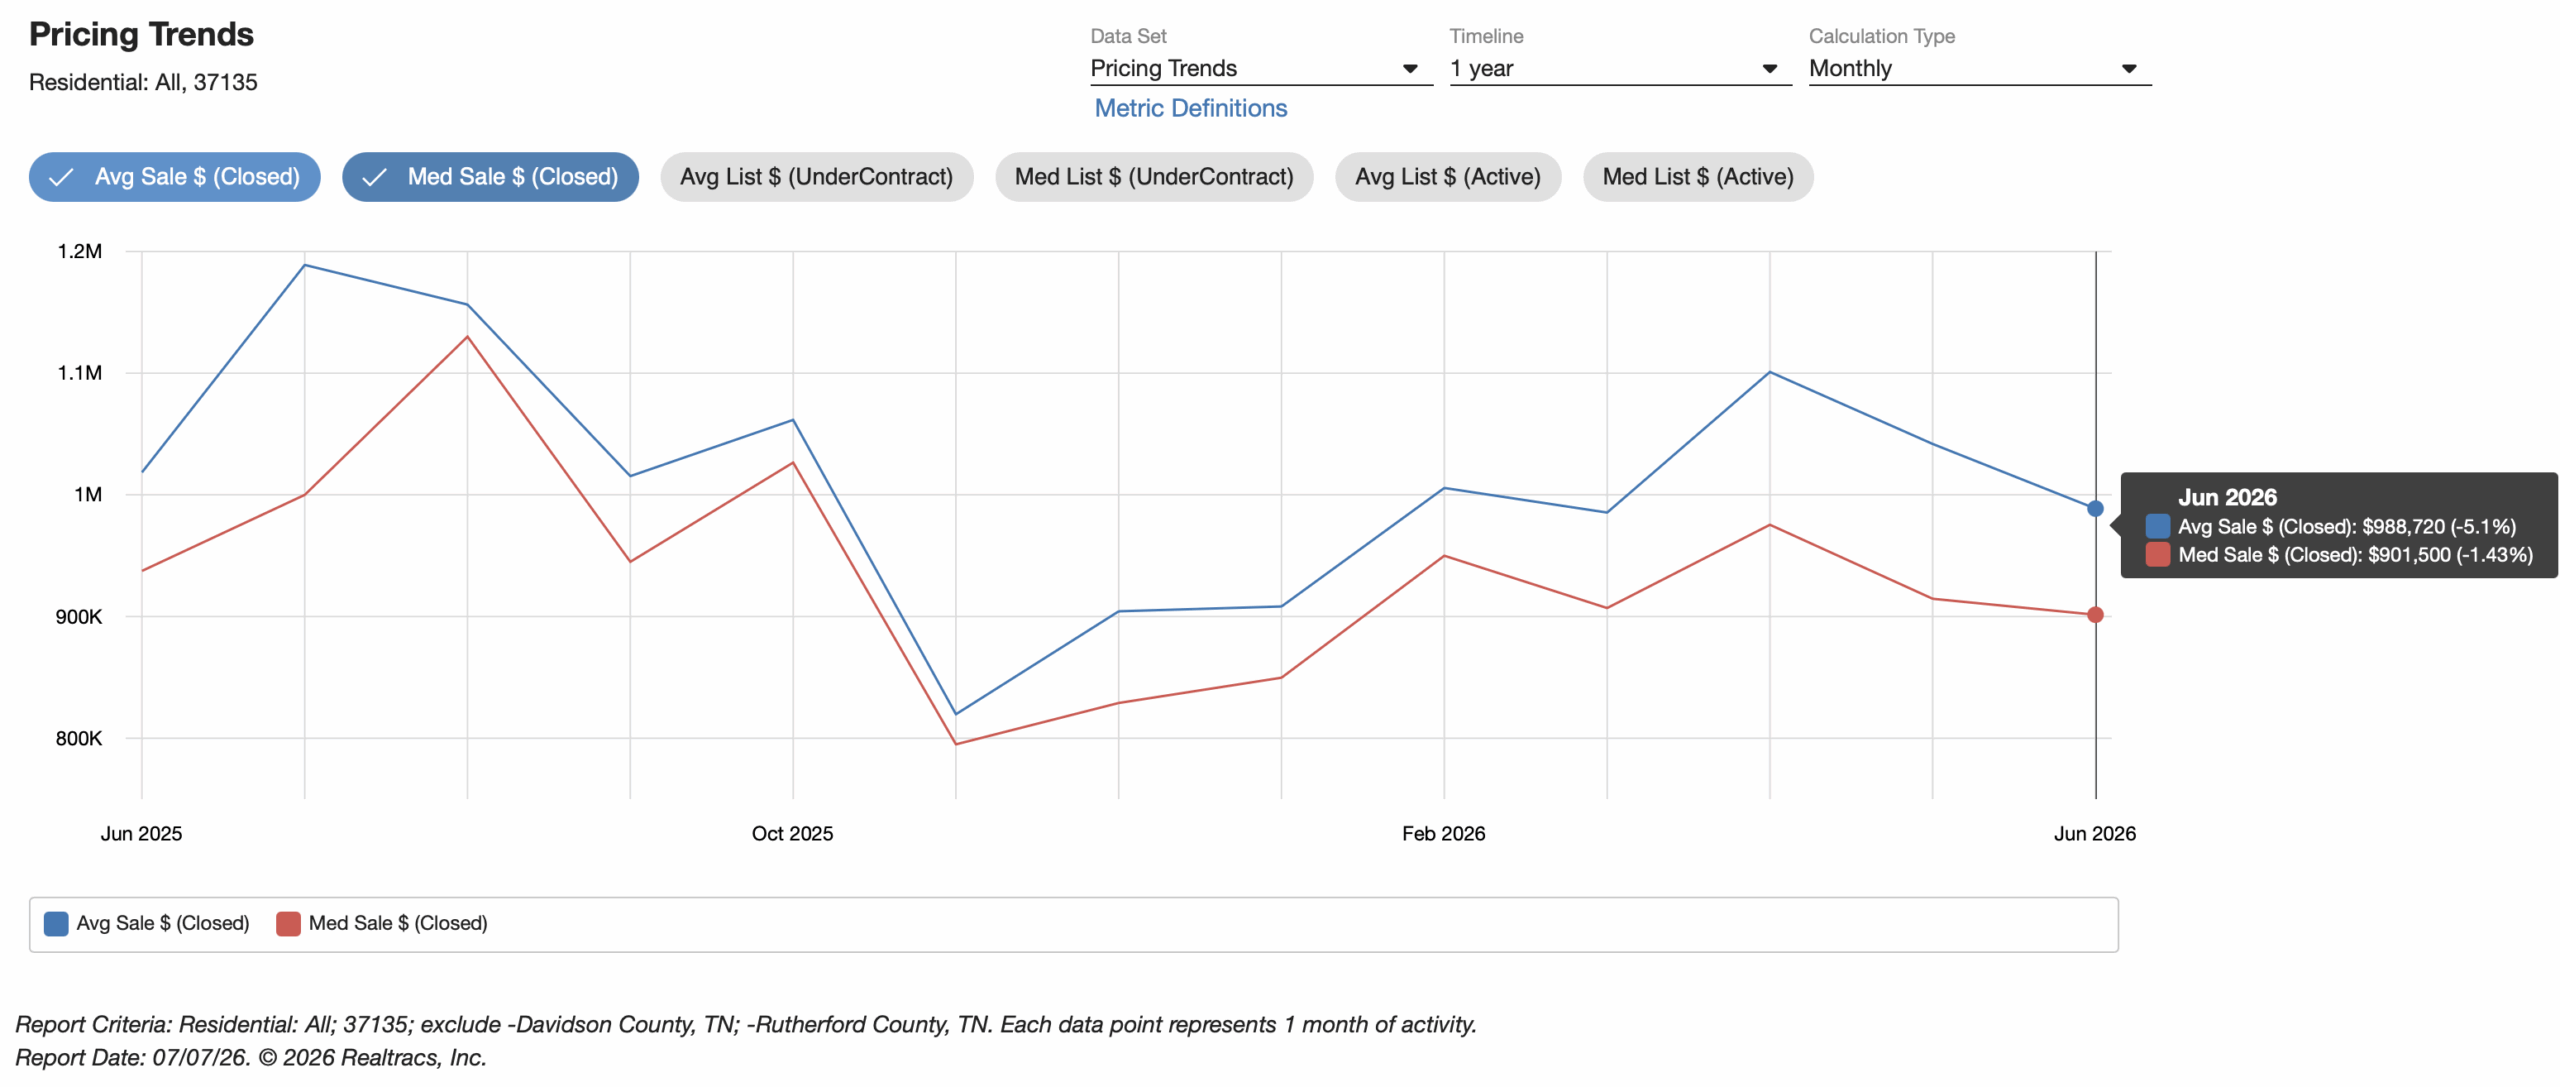
That is a different story than May, when Nolensville’s median sale price was up 2% and the average sale price was up 17% compared to the previous year.
So what happened? A few things are likely at work.
First, monthly price data in a market the size of Nolensville can be noisy. A small number of higher-priced or lower-priced closings can move the median and average from month to month.
Second, June likely reflects more buyer discipline. Homes are taking longer to go under contract, inventory is higher, and buyers are comparing more options. When buyers have more choices and mortgage payments remain elevated, they become more sensitive to price.
Third, the broader housing market is also showing signs of price normalization. Across the country, asking prices have been softening in many markets, especially in parts of the South and West. Nolensville is stronger than many markets, but it does not exist inside a glass bubble.
Still, let’s keep this in perspective.
A $901,500 median sale price is still a very strong number. Nolensville remains one of Middle Tennessee’s premium suburban housing markets. The local median price is still far above the Greater Nashville regional median sale price of $504,995.
That gap tells you something important.
Even when Nolensville cools, it is still Nolensville.
Nolensville Compared To Williamson County
Williamson County had a strong June.
Across the county, there were 555 closings, up 8% from June 2025. The median sale price rose 2% to $999,900, and the average sale price climbed 7% to $1,332,153. Months of supply was 3.78, slightly lower than last year.
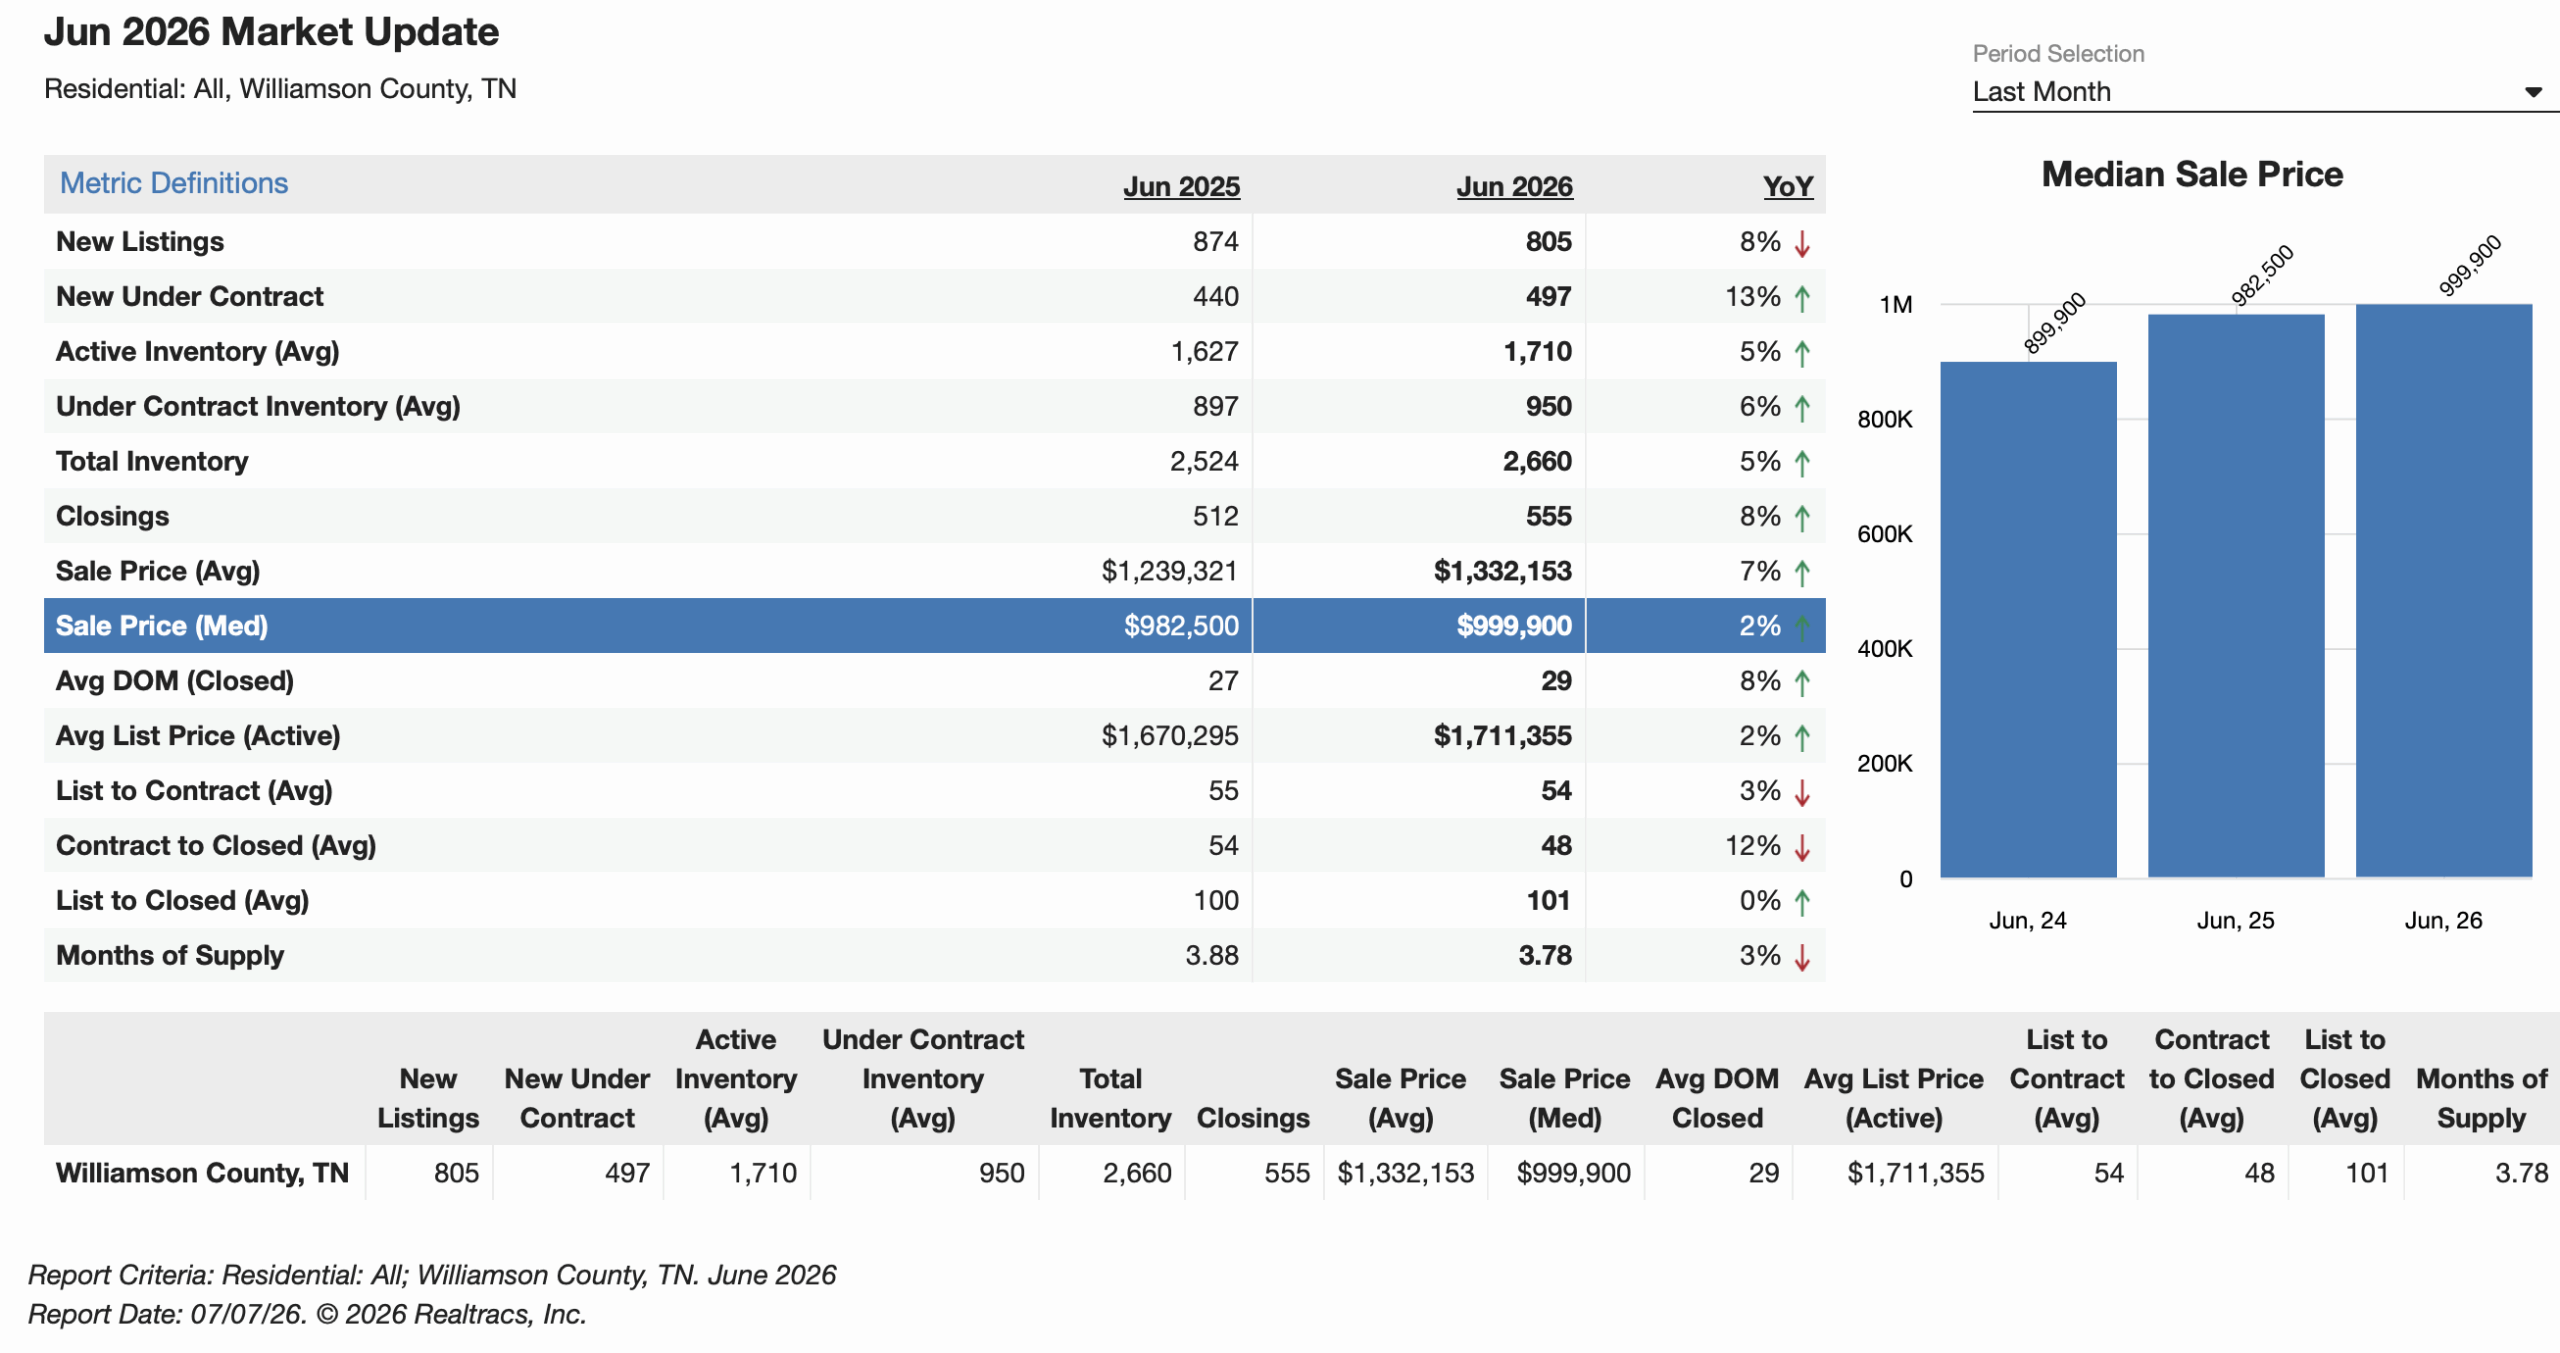
Compared to Williamson County as a whole, Nolensville was a little softer in June.
Nolensville closings were down 14%, while Williamson County closings were up 8%. Nolensville’s median price was down 4%, while the county median was up 2%. Nolensville had 4.16 months of supply, while Williamson County had 3.78.
But there is one place where Nolensville stood out in a very positive way: contracts.
Nolensville’s new under-contract activity was up 20% year-over-year. Williamson County’s new under-contract activity was up 13%.
That suggests Nolensville may simply be experiencing a timing issue in June closings, while current buyer demand remains relatively strong.
In plain English: June’s closed sales looked softer, but June’s pending activity looked better.
That matters for what may happen next.
Nolensville Compared To Greater Nashville
Across the broader Greater Nashville market, June looked fairly steady.
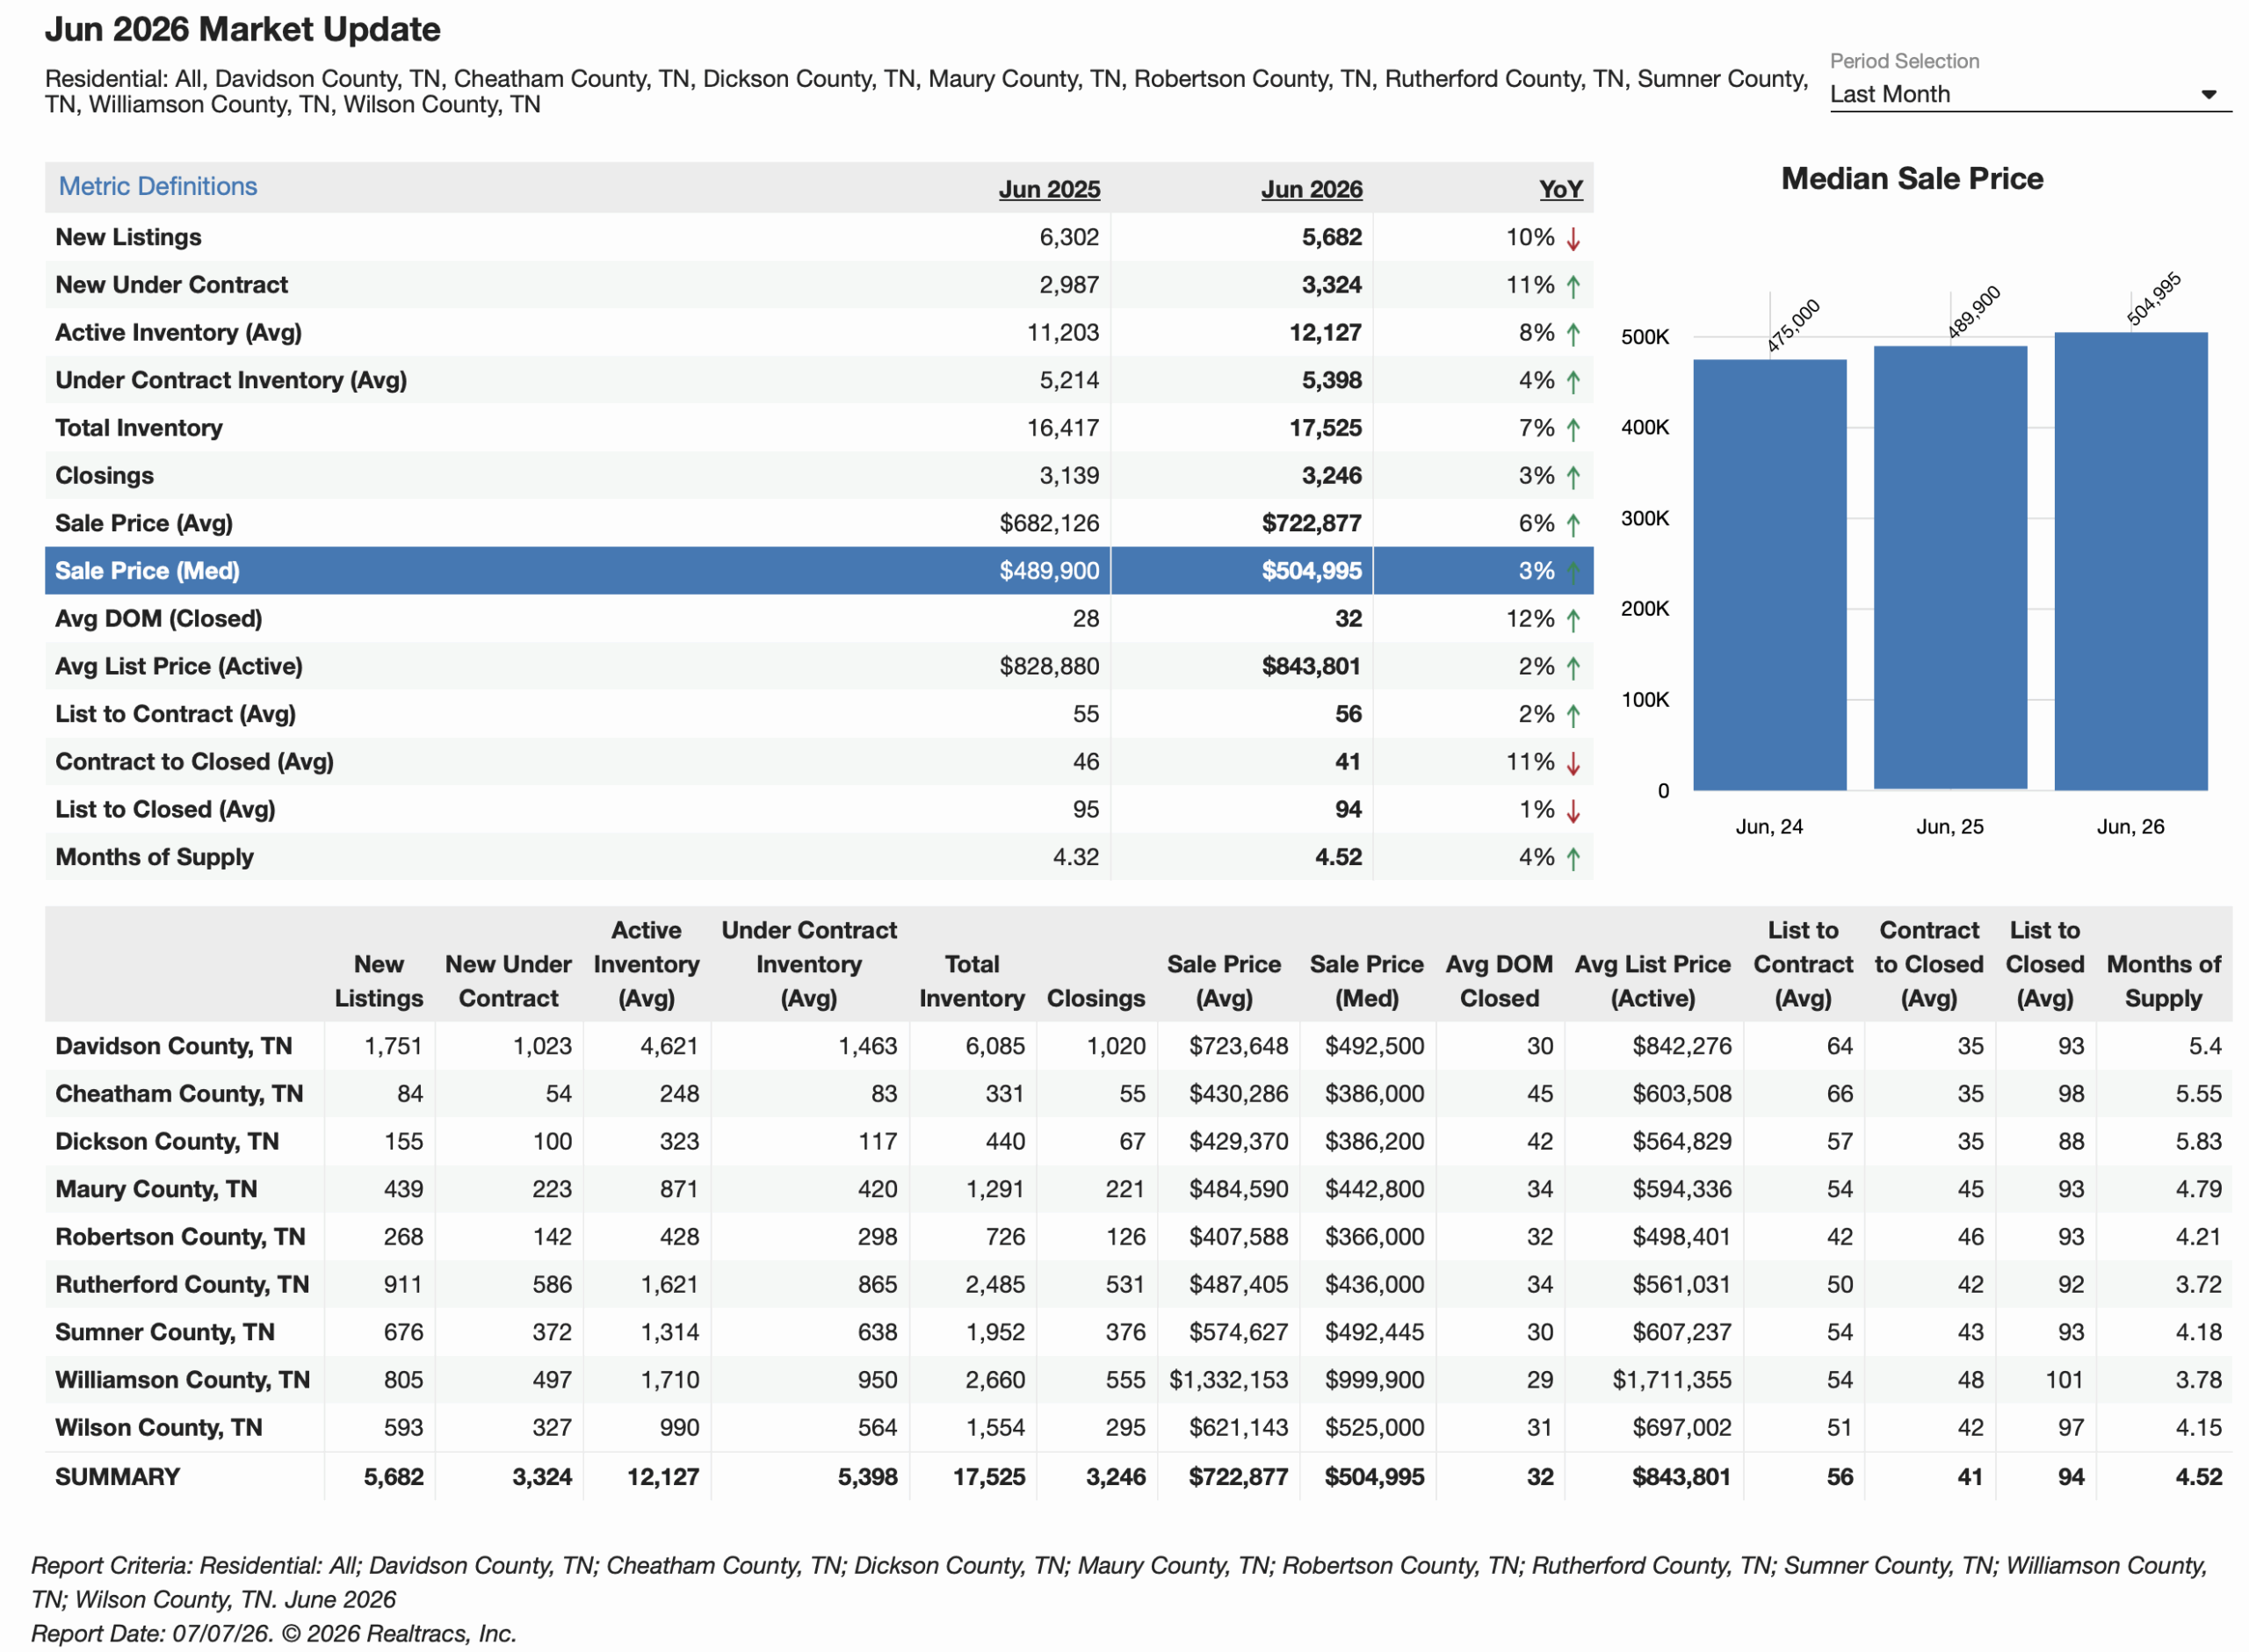
The nine-county Greater Nashville region posted 3,246 closings, up 3% year-over-year. The regional median sale price increased 3% to $504,995, and the average sale price rose 6% to $722,877.
Active inventory across the region was up 8%, and total inventory was up 7%. Months of supply came in at 4.52 months.
Compared to Greater Nashville, Nolensville remains a more expensive, higher-end, more selective market.
Nolensville’s June median sale price of $901,500 was nearly $400,000 higher than the broader regional median. That is a massive difference, and it reflects the premium that buyers continue to place on Williamson County schools, community identity, neighborhood quality, and access to Franklin, Brentwood, Nashville, and major employment centers.
However, higher price points also bring more sensitivity to mortgage rates.
When the average home buyer is shopping around $500,000, a rate change matters. When a buyer is shopping around $900,000 to $1.2 million, a rate change can be a much bigger monthly-payment event.
That is one reason Nolensville buyers may be taking longer to act. It is not that they do not want to buy. It is that the numbers have to make sense.
Buyers Are Still Moving, But They Are Taking Their Time
The most obvious sign of buyer selectivity is days on market.
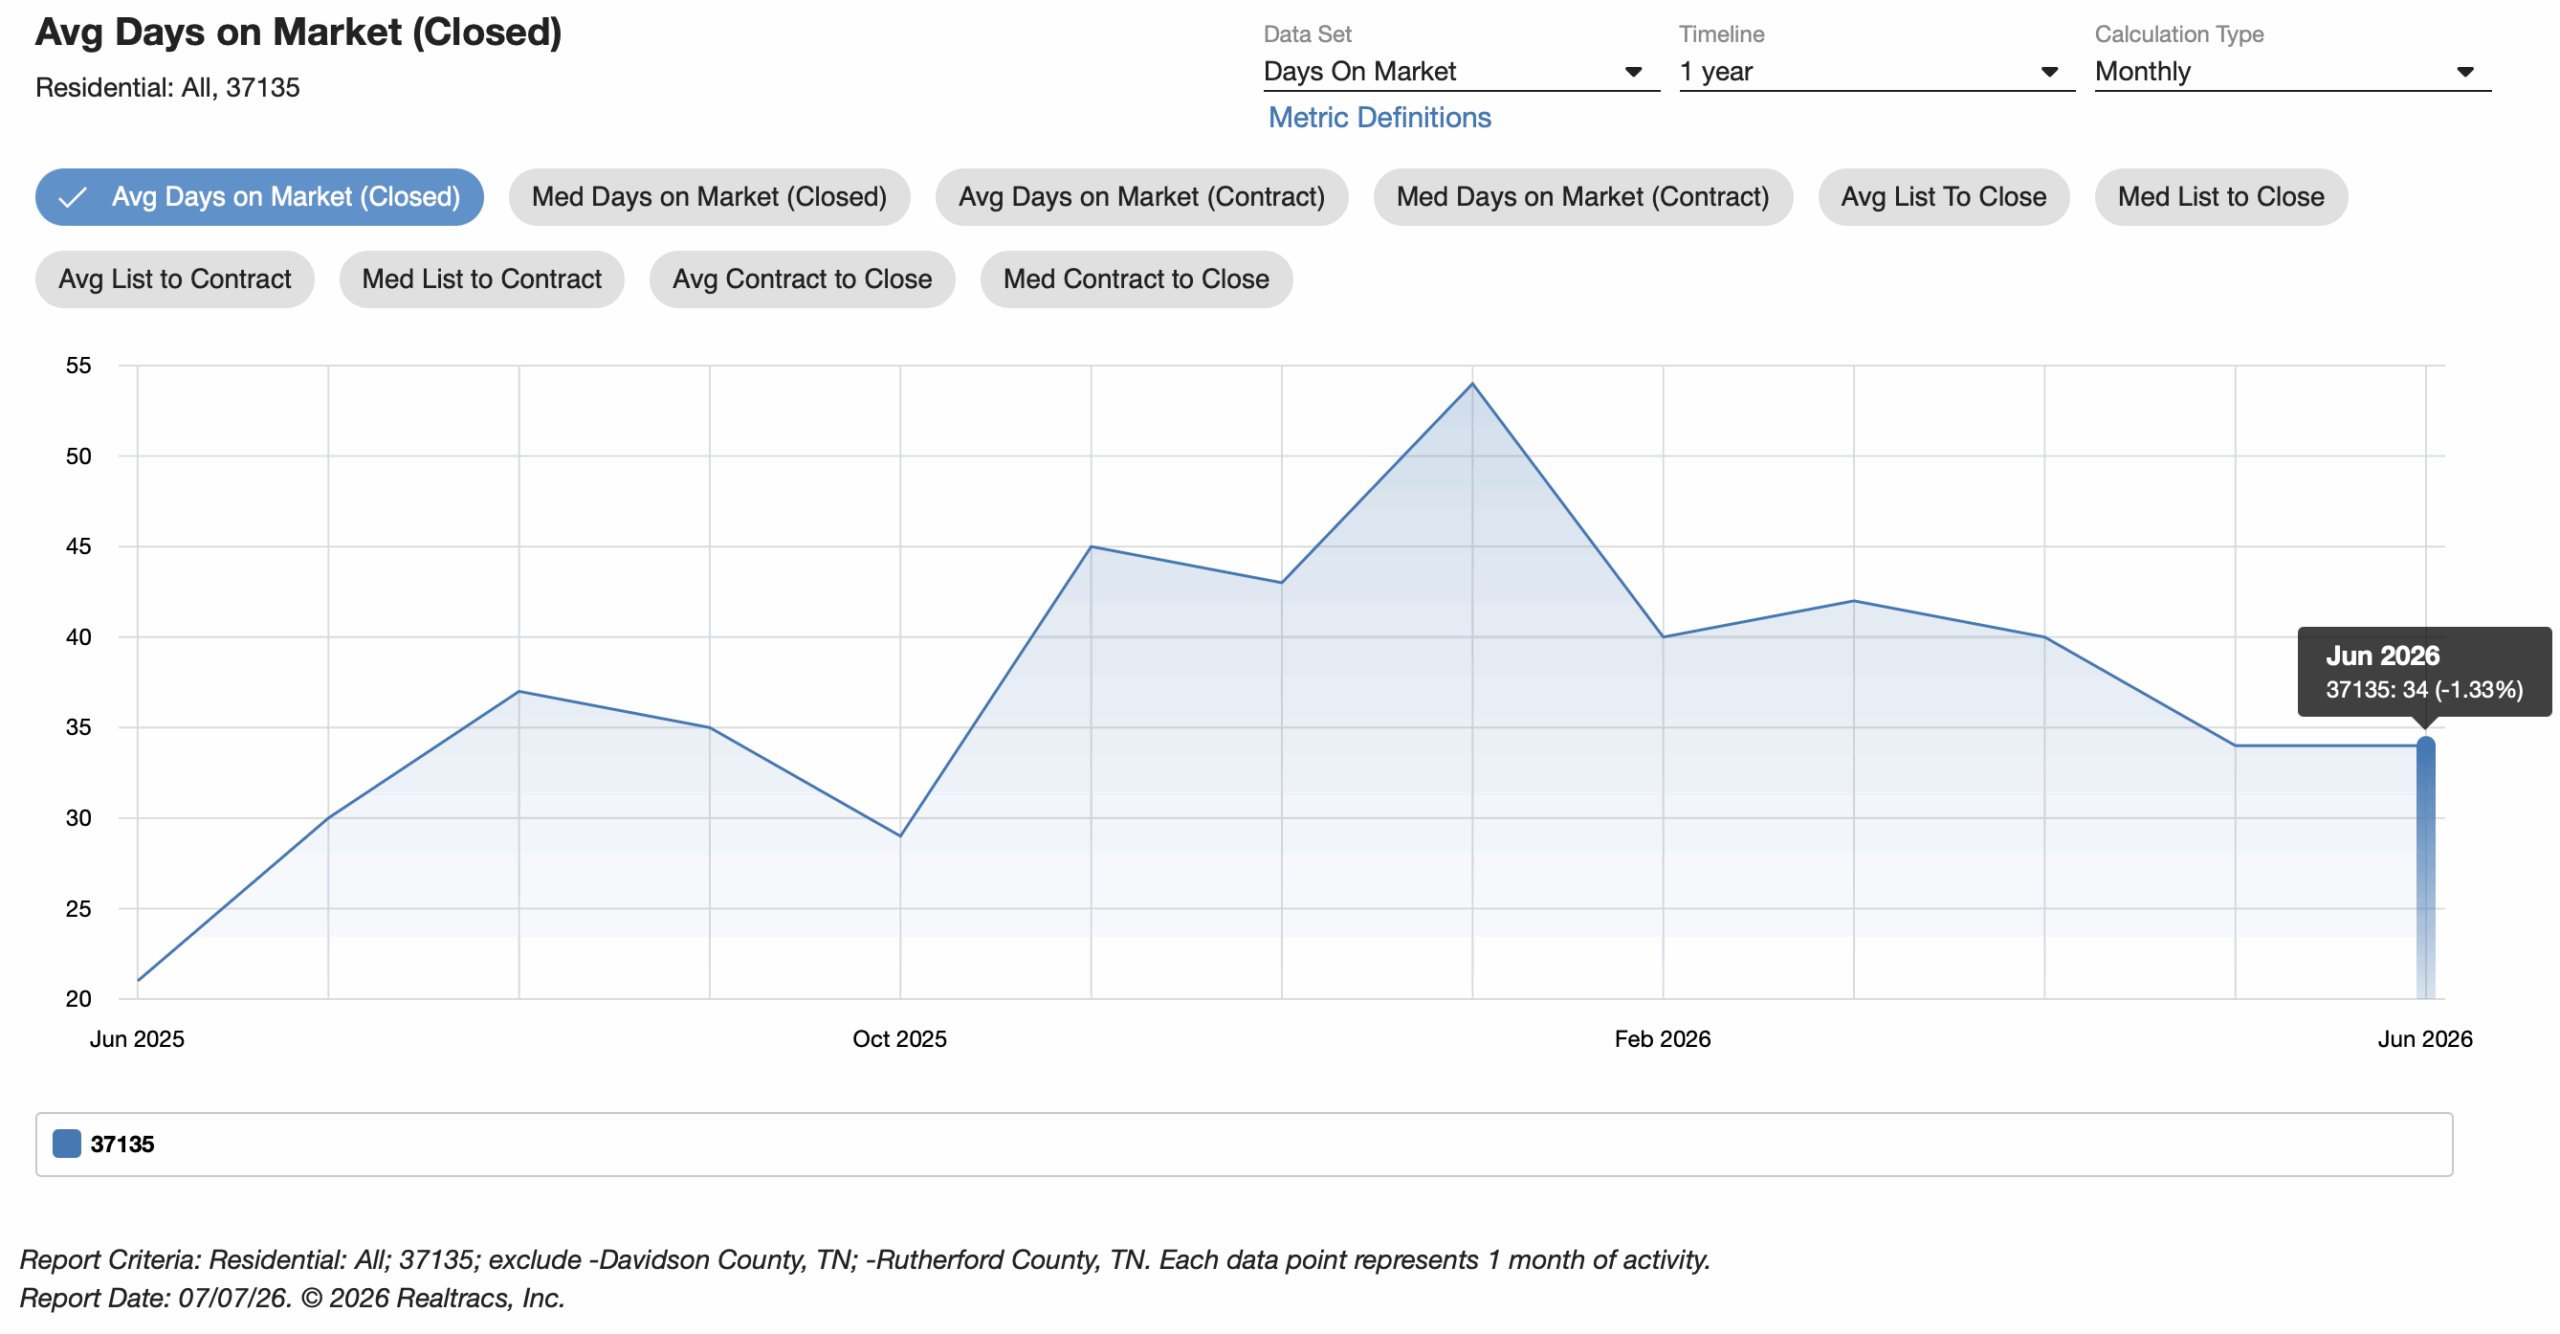
Homes that closed in June averaged 34 days on market, compared to just 21 days last June. That is a 61% increase.
That tells us something very clearly: buyers are not in a rush.
Buyers are watching. Comparing. Touring. Re-touring. Running payment numbers. Looking at competing listings. Asking about rate buydowns. Thinking through repairs. Paying attention to neighborhood, lot, floor plan, finishes, and school zoning.
Today’s buyers have more time, more choices, and more leverage than they did during the peak frenzy. But they still want good homes, and they still want Nolensville. And when the right home is priced correctly, presented well, and marketed properly, buyers still act.
The June data is not telling us buyers are gone… it is telling us they are picky.
And honestly, they have earned the right to be picky. With mortgage rates still elevated and home prices still high, buyers are going to be careful.
Sellers Need To Price With The Market, Not Their Memory
This may be the most important message for Nolensville homeowners: the market is not bad, but it is also not 2021.
A seller cannot simply look at the highest sale from two years ago, add a little extra “because my house is special,” and expect buyers to line up with bouquets and blank checks.
Today’s buyers are informed. They know what else is available. They can see price reductions. They are sensitive to condition. They are comparing resale homes against new construction. And they are much less willing to overlook deferred maintenance or dated finishes when the monthly payment is already high.
That does not mean sellers need to panic, it means sellers need to be smart!
If your home is well-prepared, well-photographed, properly marketed, and priced according to today’s buyer behavior, this can still be a very good market. The contract numbers prove that buyers are active.
But if a home is overpriced from the start, buyers may simply wait.
State And National Housing Trends Are Telling A Similar Story
The broader housing market is telling a similar story to what we are seeing in Nolensville: more balance, more inventory, more buyer selectivity, but not a collapse.
Across Tennessee, recent market data showed home prices up modestly year-over-year, sales activity improving, and inventory higher than last year. That sounds a lot like the broader theme in Middle Tennessee: the market is moving, but it is moving with more discipline.
Nationally, the story is a little more mixed.
Existing-home sales improved in May, and pending home sales also rose, suggesting that buyers are still willing to move even with mortgage rates above 6%. At the same time, national listing prices have softened, inventory has improved, and price cuts remain part of the summer conversation.
That is not necessarily bad news – it means the housing market is gradually becoming more normal. Sellers are being forced to be more realistic. Buyers are getting a little more breathing room, and homes are still selling when price, condition, and location line up.
For Nolensville, that national backdrop matters because buyer psychology is shaped by more than just local data. Buyers read headlines. They watch mortgage rates. They hear about inventory. They know when the market is shifting.
But, local fundamentals still matter most, and Nolensville continues to have strong fundamentals: desirable schools, newer housing stock, community identity, proximity to Nashville and Franklin, attractive neighborhoods, and a lifestyle that continues to pull buyers into Williamson County.
Mortgage Rates Are Still The Main Character
If the housing market were a movie, mortgage rates would still be the main character – not the hero and not necessarily the villain, but definitely the character controlling way too much of the plot.
As of early July, the average 30-year fixed mortgage rate was still generally in the mid-6% range, depending on the source and loan scenario. That is lower than the highs we saw in 2023, but still high enough to keep affordability tight.
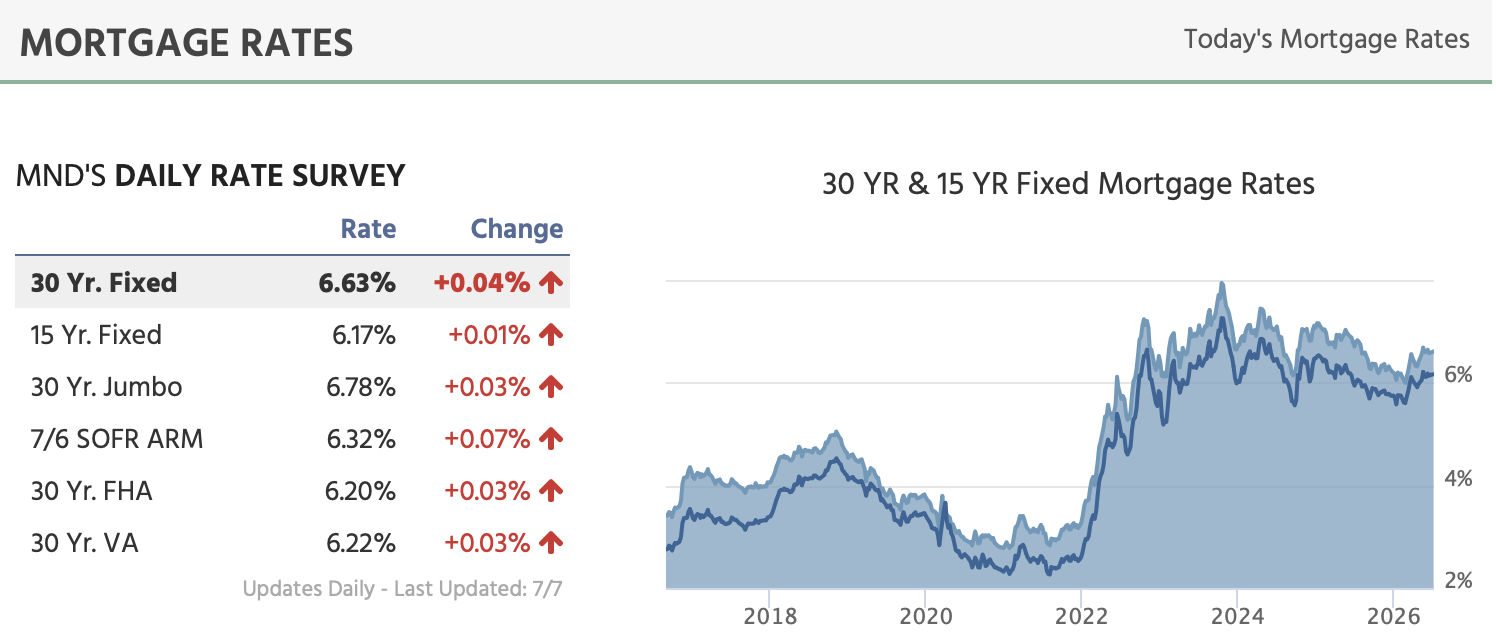
graphic by Mortgage News Daily
For Nolensville buyers, the difference between a 6.0% rate and a 6.6% rate can be meaningful. Even a small move in rates can noticeably change the monthly payment.
That is why some buyers are still cautious. They may love Nolensville – they may want the schools, the neighborhood, the backyard, the home office, the bonus room, and the three-car garage.
But they still have to make the payment work.
Looking ahead, I would expect mortgage rates to remain one of the biggest drivers of market activity. If rates drift lower later this year, Nolensville could see another burst of buyer demand. If rates stay elevated, buyers will likely remain active but selective.
In other words, the demand is there, but the payment has to cooperate.
What Happens Next?
Here is my honest read on the Nolensville market moving into the second half of 2026.
I do not believe the local market is weak. I also do not believe it is effortless.
We are likely moving into a more normal, more balanced market where the best homes still perform well and overpriced homes sit longer than sellers expect.
The most encouraging number in the June data is the 20% year-over-year increase in new contracts. That tells us buyers are still choosing Nolensville. The most cautionary numbers are the 4% drop in median sale price, the 14% drop in closings, and the increase in days on market. That tells us buyers are choosing carefully.
So, the market is not sending one message, it is sending two: Buyers are active. Buyers are selective.
That is the market.
What Should Nolensville Sellers Expect?
If you are thinking about selling a home in Nolensville, the opportunity is still real, but the margin for error is smaller.
A strong listing strategy should include accurate pricing, thoughtful preparation, professional photography, compelling online presentation, smart launch timing, and a willingness to respond to market feedback.
Homes that look great online and feel right in person are still going to attract attention.
Homes that are priced too aggressively, poorly presented, or competing against better options may struggle.
The days of throwing a listing online and waiting for a bidding war are mostly behind us. The good news is that a well-executed listing can still stand out in a major way.
What Should Nolensville Buyers Expect?
If you are hoping to buy a home in Nolensville, this market is more approachable than it was during the peak frenzy.
You have more options… you may have more negotiating room… you may have more time to think. And in some cases, sellers may be willing to help with closing costs, repairs, or rate-buydown strategies.
But do not mistake more balance for unlimited leverage.
The best homes are still the best homes. If a property is well-priced, well-maintained, in a strong location, and checks the boxes buyers care about most, it can still move quickly.
The smartest buyers right now are prepared. They understand their financing. They know their payment comfort zone. They watch new listings closely. And when the right house appears, they are ready to act.
Is Nolensville In A Buyer’s Market Or Seller’s Market?
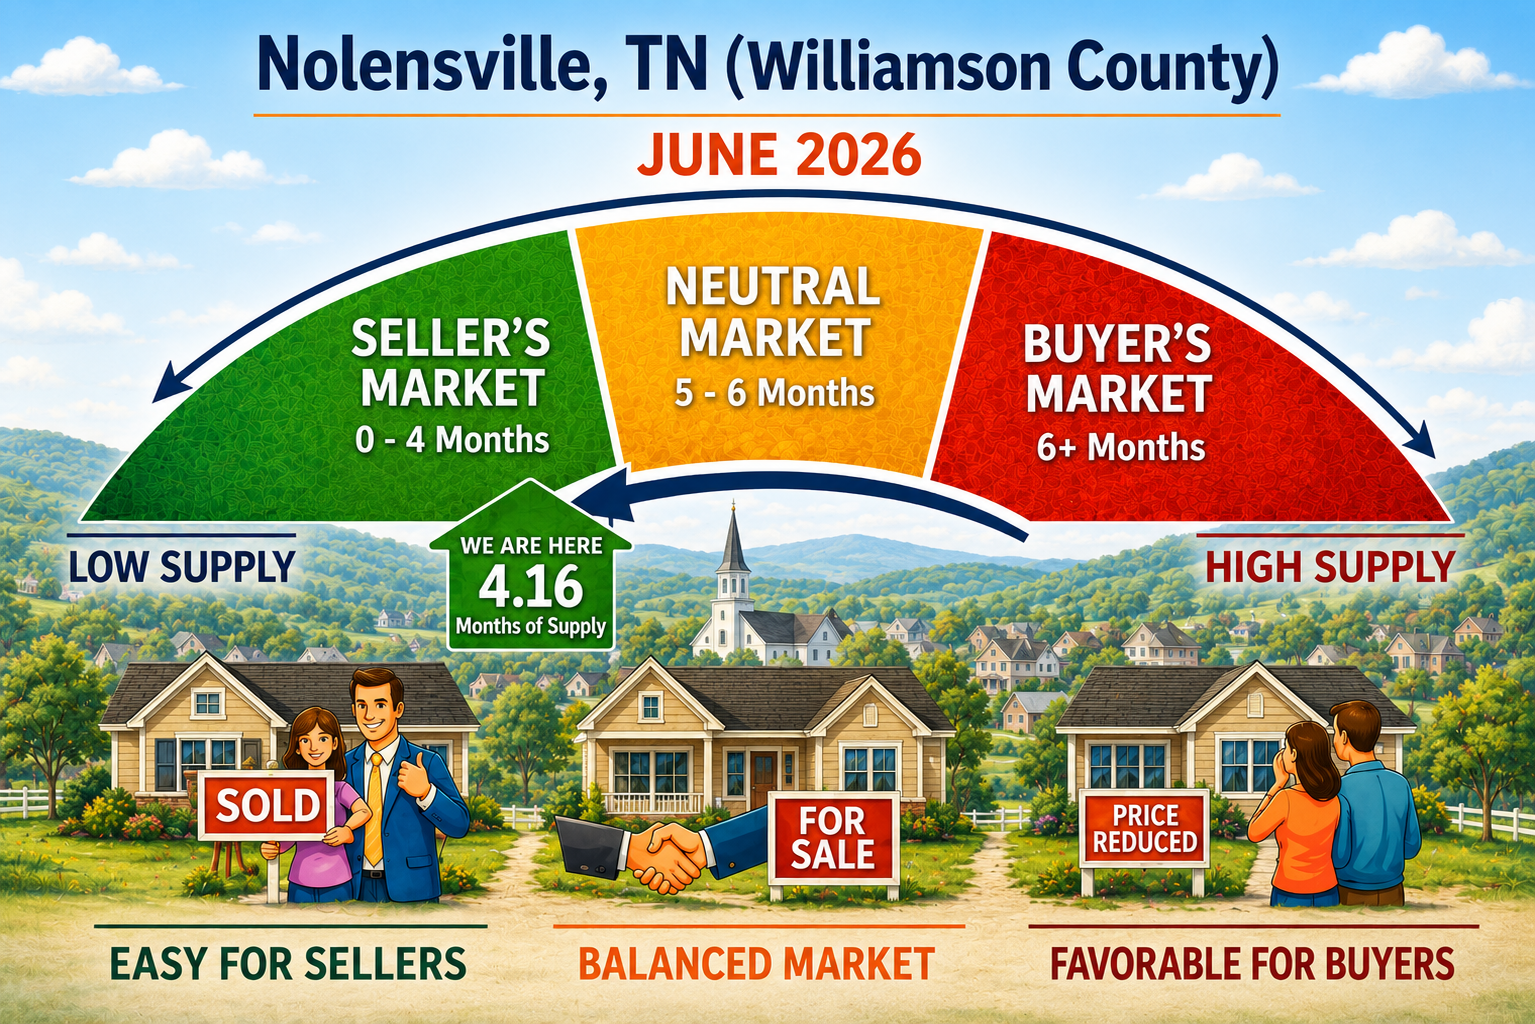
Based on June’s 4.16 months of supply, Nolensville is moving closer to balance.
It is not a strong buyer’s market. It is not the extreme seller’s market of a few years ago. It is best described as a balanced-to-slightly-seller-favorable market, depending on the price range, condition, location, and competition.
Some homes will still feel like they are in a seller’s market, others will feel very buyer-friendly.
That is what happens when the market becomes more selective. The overall data matters, but the micro-market matters even more.
A move-in ready home in a desirable neighborhood may perform very differently than an overpriced home needing updates. A home under $1 million may attract a different buyer pool than a home over $1.5 million. A property with a premium lot, strong floor plan, and great presentation may outperform the market.
The averages tell part of the story. The individual listing tells the rest.
In Conclusion…
The June 2026 Nolensville real estate market was not as strong as April or May, but it was far from weak.
Closings were down. Prices pulled back slightly. Inventory increased. Homes took longer to go under contract, but buyer demand did not disappear.
New under-contract activity was up 20% year-over-year, and year-to-date sales activity remains ahead of 2025. That is a very important sign.
The market is no longer running on adrenaline… it is running on fundamentals. And Nolensville still has very strong fundamentals.
This is a market that rewards sellers who prepare properly, price accurately, and market aggressively. It also rewards buyers who are patient, informed, and ready to act when the right opportunity appears.
The best way to describe the current Nolensville housing market is this: balanced, selective, and still very desirable.
For sellers, the opportunity is still there — but execution matters. For buyers, the market is more approachable — but great homes are not going unnoticed.
 If you are thinking about buying or selling a home in Nolensville, I would be happy to help you understand what these numbers mean for your specific situation.
Give me a call or text at 615-500-6393, or email me at flint@theguidehome.com.
Interested in up-to-date Nolensville TN real estate sales figures? I can email you an hourly updated look at Nolensville real estate activity, including what has gone pending, price-reduced, and withdrawn. Just send me your name and preferred email address.