


by Flint Adam, Nolensville resident & Realtor®
(Note: all data below is for Nolensville properties within Williamson County. Excluded are Nolensville homes sold in Davidson and Rutherford counties).
Don’t let national headlines about a softening real estate market fool you – Nolensville remains as hot as ever.
The first quarter numbers are in and they are record-setting. 130 Nolensville (Williamson Co.) homes sold during Q1, handily beating the former first-quarter champion (2017) when 116 homes sold.
 The record is made all the more impressive considering the median price of a Nolensville home last quarter was $541,195 compared to $487,214 back in Q1 of 2017. Despite record-high prices, sales just keep on a’coming!
New construction was the big mover, tallying 60% of all Nolensville homes closed. Existing home-sales are typically slower during the cold-weather months, picking up during the spring and carrying much of the summertime activity.
Average days on market (before contract) for resales totaled 45 during the first quarter… barely higher than 2018’s 44 days. It’s a far cry from 2017, though, when resales spent an average 22 days on market before finding a buyer. Meanwhile, the average list-to-sales-price ratio among existing homes in Q1 was 98.12%… down from 98.90% a year earlier.
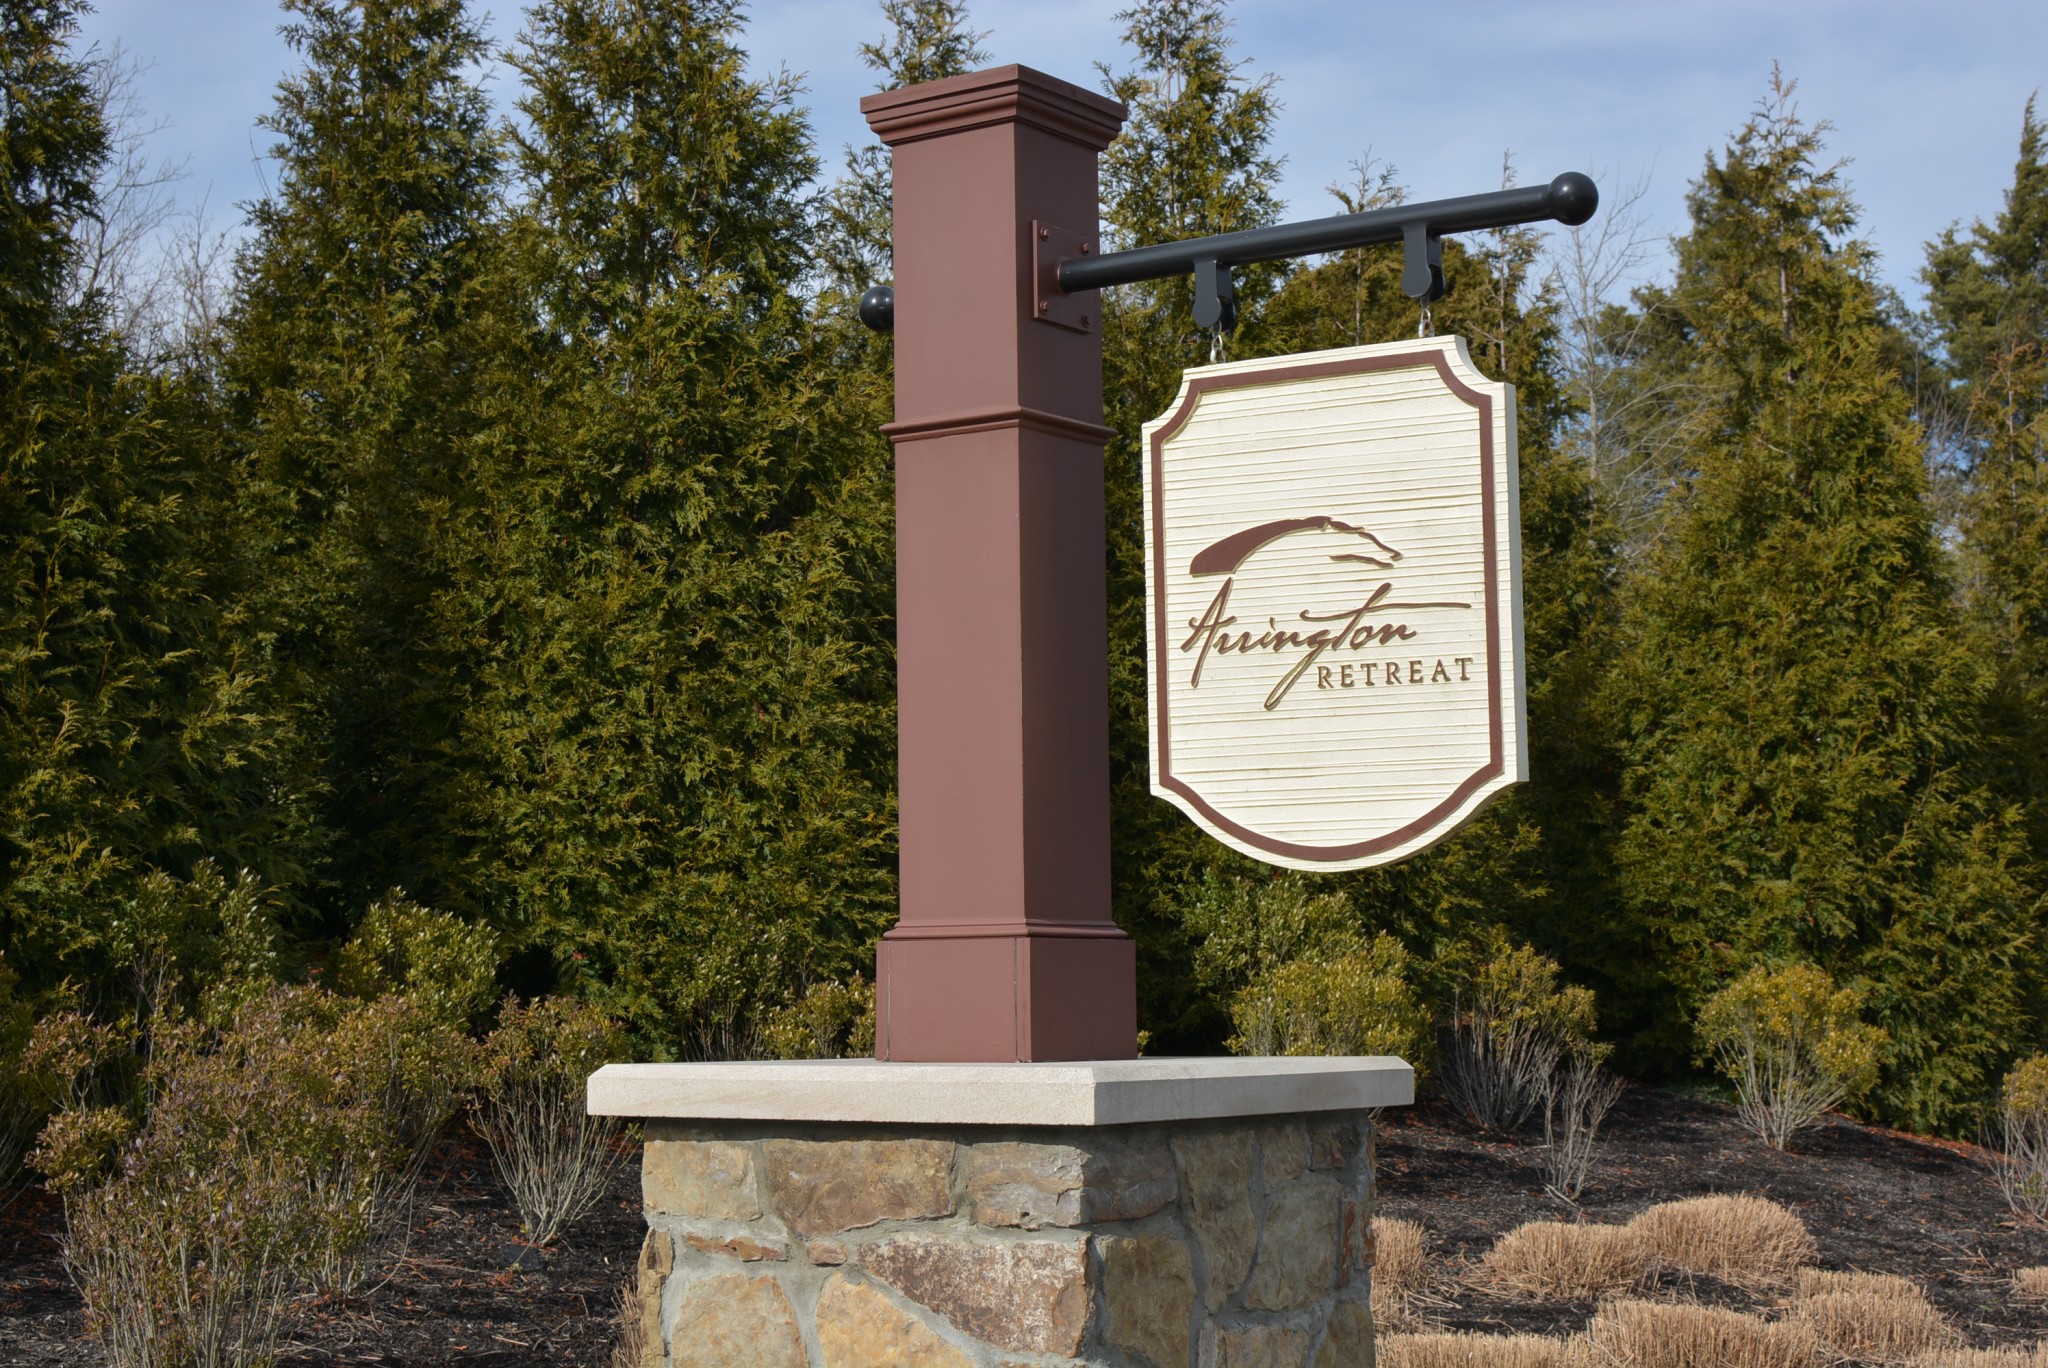 Arrington Retreat was the top-selling neighborhood, bringing 13 sales. Summerlyn was next with 12 sales followed by Bent Creek at 11 homes sold.
The highest-priced sale belongs to 9816 Sam Donald Road at $2,900,000. The gorgeous, estate-property spent several years on and off the market before finally closing on January 30th.
Best-Selling March Ever…
The record first-quarter has the month of March to thank for it. 55 homes sold in Nolensville last month, an almost 20-percent jump from the prior record set last year when 46 homes closed.
Two-thirds of the sales were new construction – which remains a primary driver of activity here in town – but the nineteen resales did a fine job spending an average 38 days on market and closing at a 98.09% list-to-sales-price ratio.
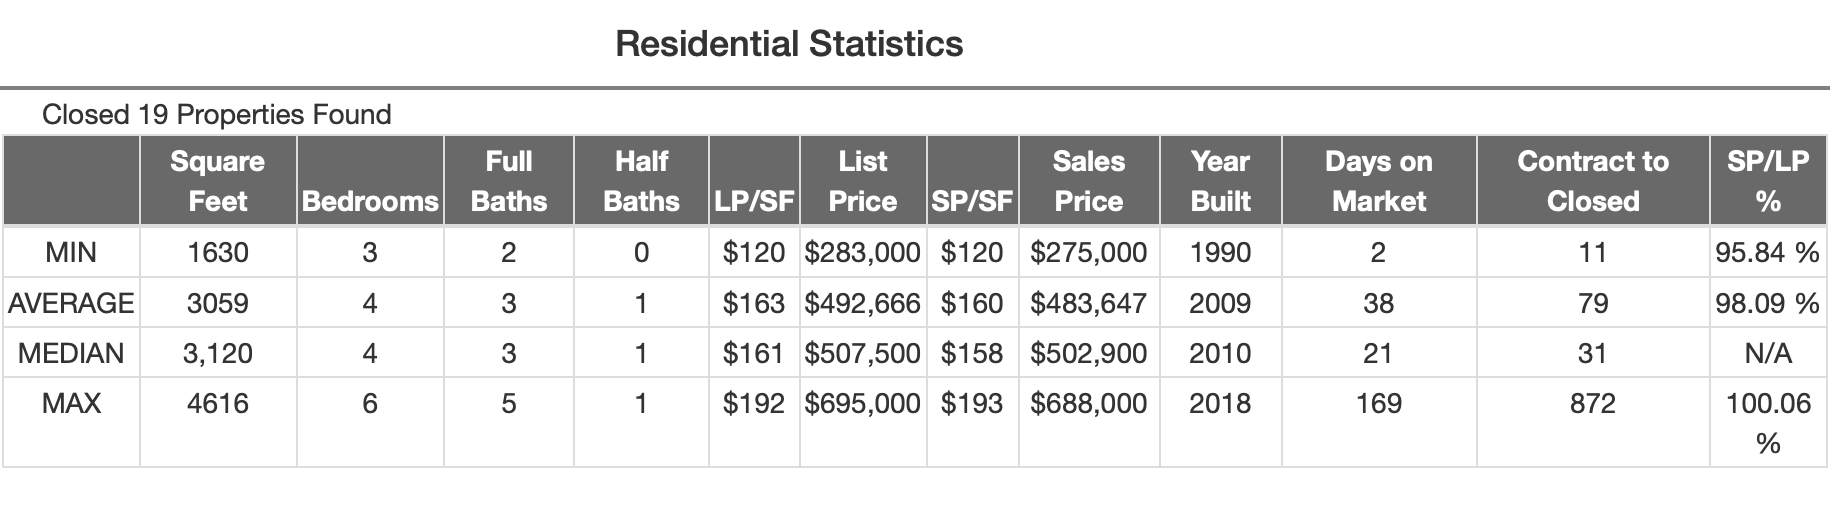
March 2019 Nolensville Resales MLS Data
There were slightly fewer existing homes closed last month (19) than the year before (21 in March 2018), and the sales-price-to-list-price ratio slightly decreased from March 2018’s 98.29% average, but we saw improvements on a couple other fronts:
- Days on market in March ’19 decreased 21% year-over-year: March 2018’s figure was 48 DOM.
- Average sales price slightly increased (0.84%) in March ’19: March 2018’s figure was $479,623
Of note here is that prices are pretty stable year-over-year, which is a theme I’m predicting for 2019. The good news, though, is the Nolensville market (so far) maintains a healthy appetite, and with mortgage interest rates down and home prices flattening out – this should help real estate continue plowing forward in the year ahead.
Spring Market is Underway…
This is when it heats up, folks. The graphic, below, illustrates total month-by-month home sales in Nolensville so far this decade. March is the big bump, with typically a little less action in April before things really get hustling in May.
If you’re thinking about listing your house for sale this year, now is the time you should begin meeting with a Realtor and discussing timing, pricing, and marketing. I’m at your service if you want a Nolensville real estate expert.
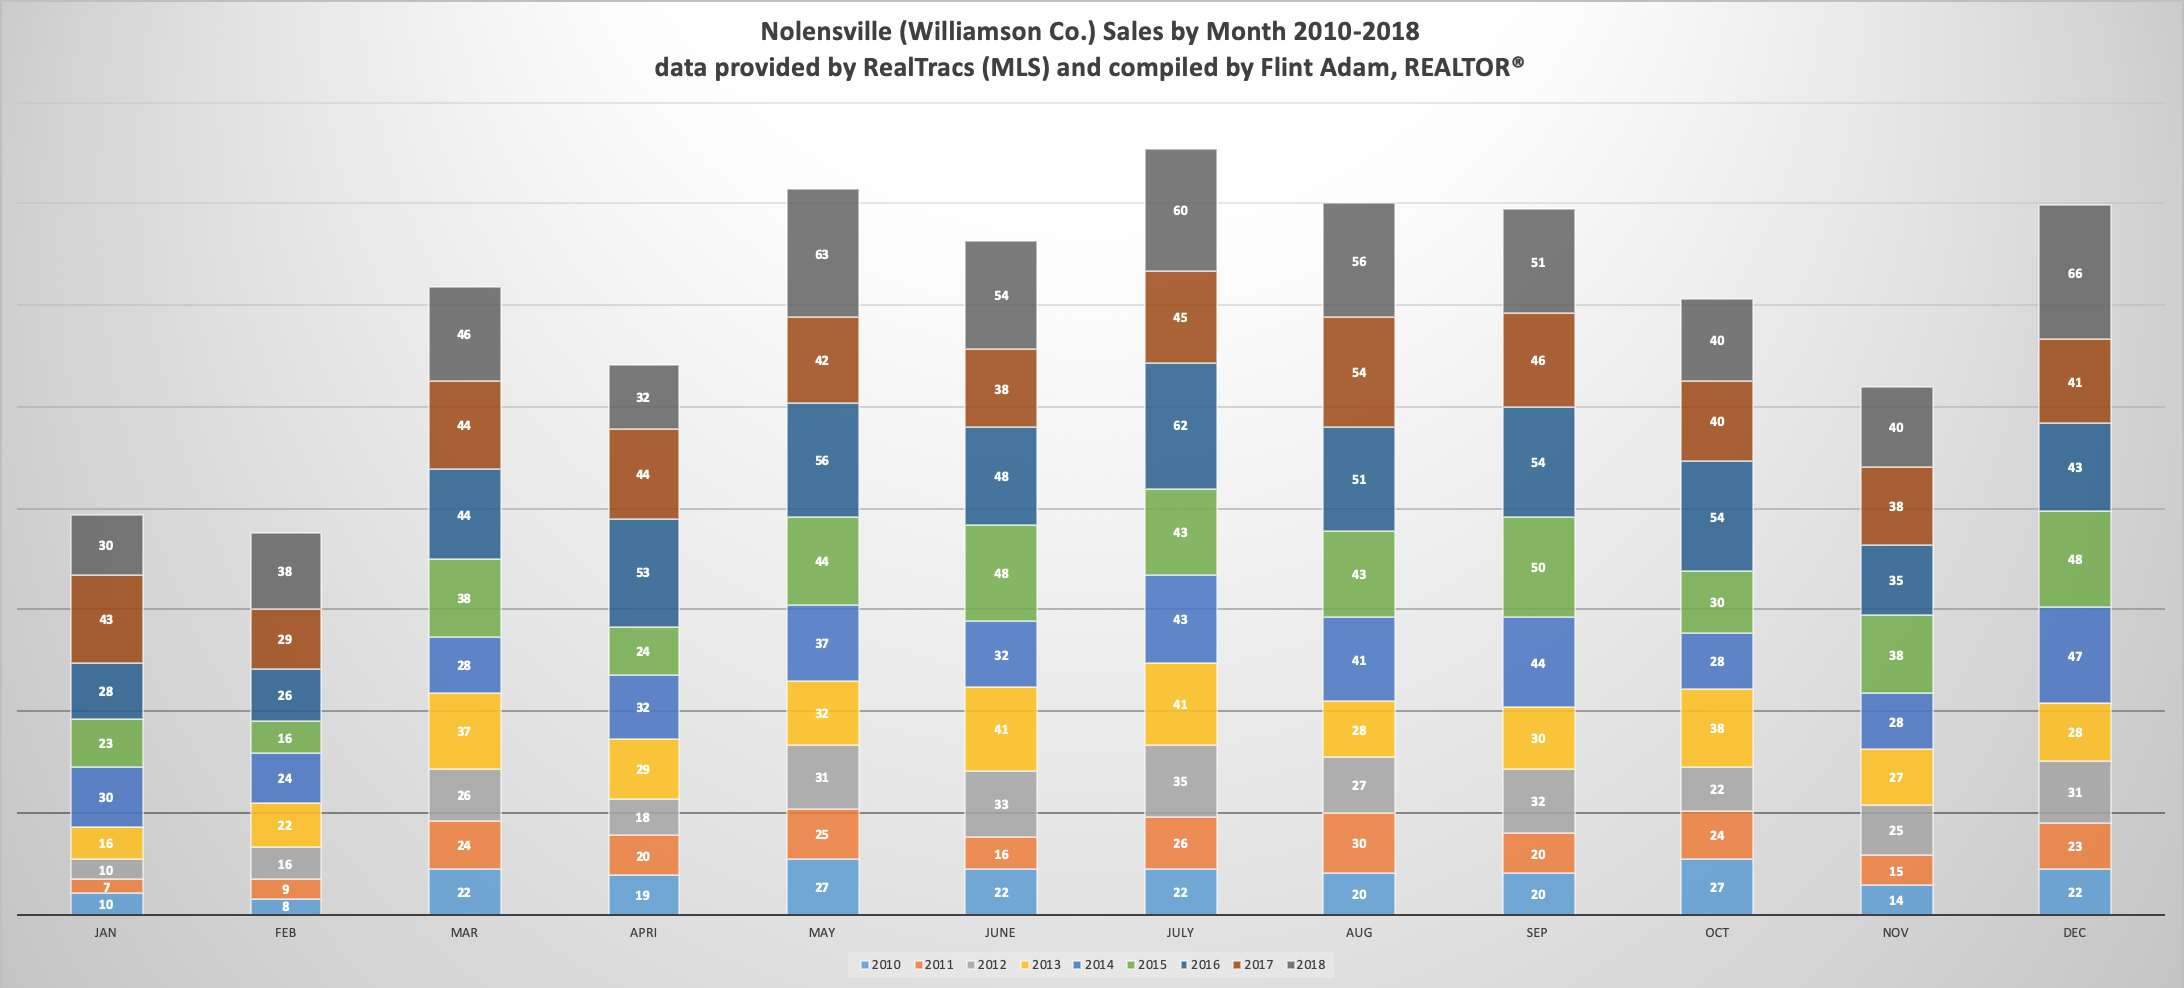
Click graphic to enlarge
Williamson County March 2019 Home Sales…
While Nolensville sold like hot-cakes, Williamson County March sales as a whole took a notable dive year-over-year.
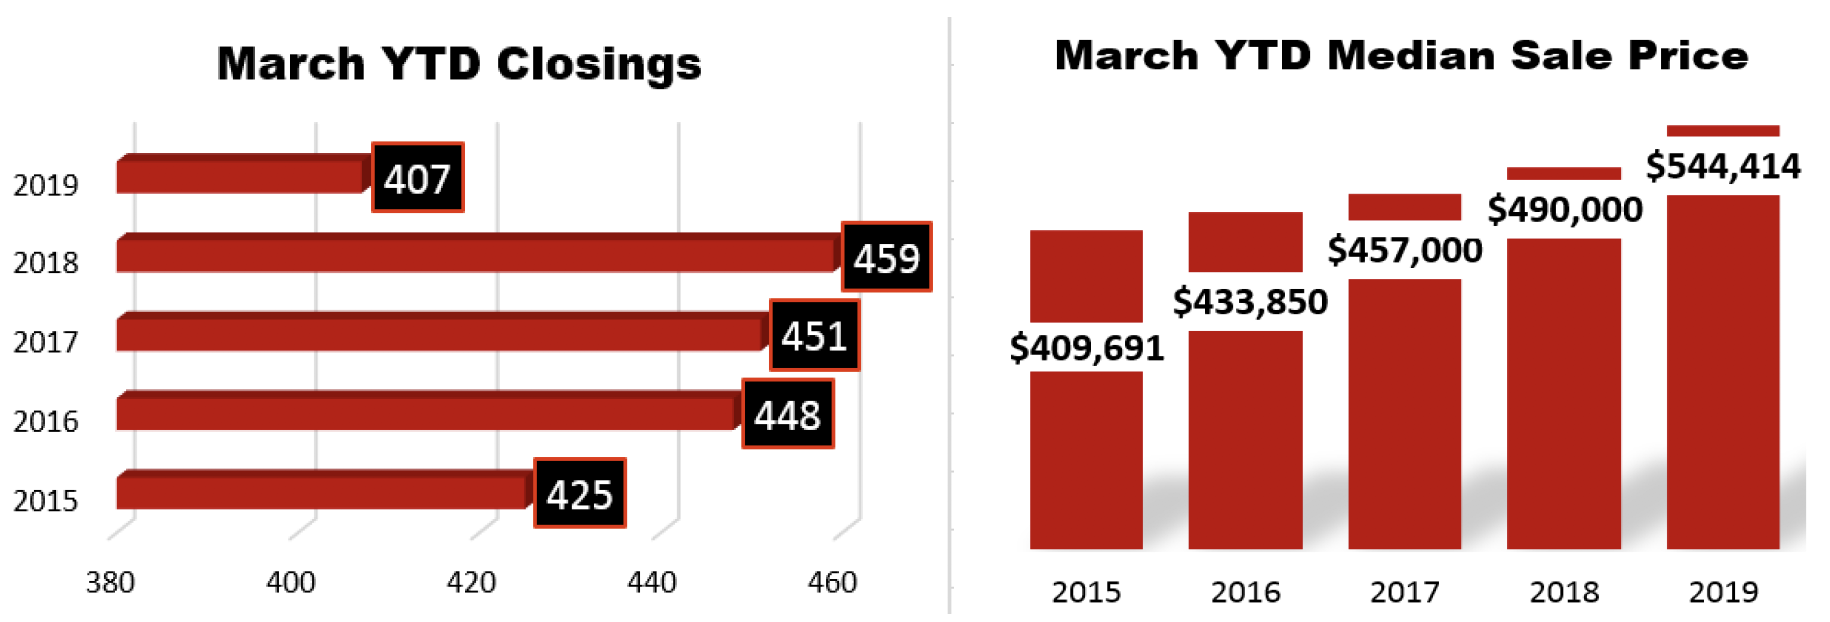 The dive is substantial (-11.33%), ending a multi-year run of year-over-year gains. In fact, the 407 Williamson County sales in March 2019 is the lowest total since 394 homes closed in March 2014.
The average price of a home in Williamson County may be partly to blame. The average sales price of a home in our county rose 11.1% year-over-year.
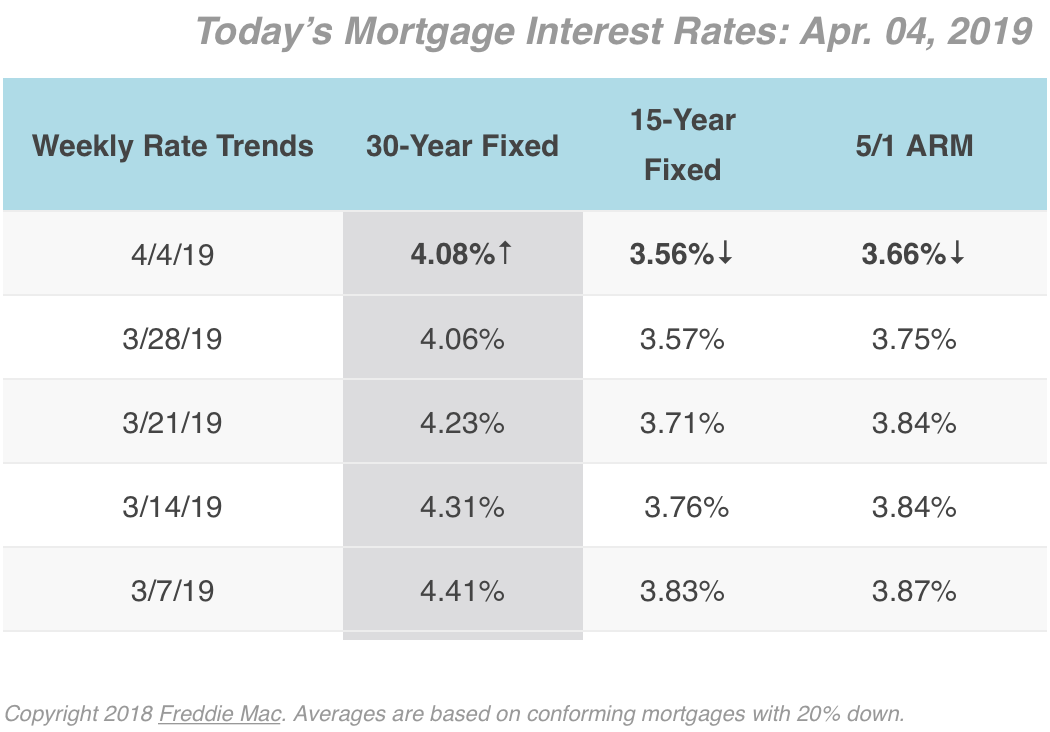
Mortgage Rates Remain Level & Low…
From My Mortgage Insider.com:
Overall mortgage demand rose to the highest level since 2016 according Freddie Mac Chief Economist Sam Khater. Joel Kan, MBA’s Associate Vice President of Economic and Industry Forecasting noted of last week’s mortgage activity, “The average loan size for purchase loans declined slightly, as applications for smaller purchase loan sizes exceeded that of higher loan sizes — a positive sign that first-time buyers were increasingly active in the market.”
The interest rates reported below are from a weekly survey of 100+ lenders by Freddie Mac PMMS. These average rates are intended to give you a snapshot of overall market trends and may not reflect specific rates available for you.
Schedule a Personal Consultation…
If you’re wondering what your Nolensville home is worth in today’s market, just want a better understanding of current trends, or are interested in relocating to or within Nolensville, give me a call and we’ll sit down and cover all the bases.
There is never any obligation to work with me, but it’s fun meeting people face to face and hearing their story. I’m at your service and look forward to offering more Nolensville expertise in the years ahead!

Flint Adam is a Nolensville resident and lives with his wife and children in Bent Creek. He focuses his practice in town, having served almost 100 buyers and sellers in closed Nolensville real estate transactions. Flint enjoys blogging about real estate, traveling the world, photography, and bourbon-hunting. He is passionate about serving Nolensville and keeping it one of America’s greatest small towns.